It is shocking to see record bearish sentiment on many of the sentiment charts at the end and equally shocking how quickly we've recovered off the lows to a more "neutral" position.
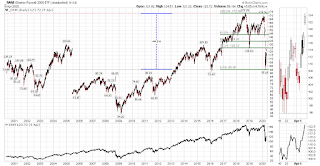
For the year, the Dow, S&P 500 and Nasdaq are down 16.9%, 13.7% and 9.1% respectively with the Russell 2000 still in bear territory down 25.3% YTD .
After falling 36% to a bear market low of 2,191.86, the S&P 500 has rallied 29% to a new, cyclical bull market high while covering just over 50% of its loss from the peak.
While the the Dow, S&P 500 and Nasdaq are now down less than 20% from their peaks, the Russell 2000 trails significantly at down 28.4%.
Intel (INTC) is one of the "great trading stocks" I cover in "Kirk Lindstrom's Investment Letter" where I trade Intel around core positions.
I took profits in January at $66.57 then used the bear market decline to buy the shares back at a $14.65 discount ($66.57-$51.92=$14.65) in March.
Here is a copy of the email alert I sent my subscribers to REMIND them Intel reached the price I published in the newsletter for buying shares back.
More Intel charts. The second chart at that link has a very cool AI (Artificial Intelligence) feature that draws resistance and support lines on the one-year graph.
Now with the great, big rally from the bottom, we are very, very close to my "take profits" points for many of these stocks. Some are still closer to the buy points so it is not too late either. IF this turns out to be a long, secular bear market with cyclical bull market rallies, then I should continue to profit from that volatility.
Kirk Lindstrom's Investment Letter
Don't miss out!
Get April Issue For Free!
Get April Issue For Free!
Here are a few, important investor sentiment charts that I cover in my newsletter. You can see there was record fear at the bottom of this bear market before the current bull market started.
Come discuss this article and more on my Facebook "Investing for the Long Term" group!


