Don't Miss Out On Great Gains! - Best Investment Newsletter


Click for FREE sample of Kirk Lindstrom's Investment Letter

Don't miss out! Subscribe Now

google.com, pub-7001134751860982, DIRECT, f08c47fec0942fa0

Search For More

Showing posts with label Bull Market. Show all posts

Tuesday, August 01, 2023

Market Update for July 31, 2023

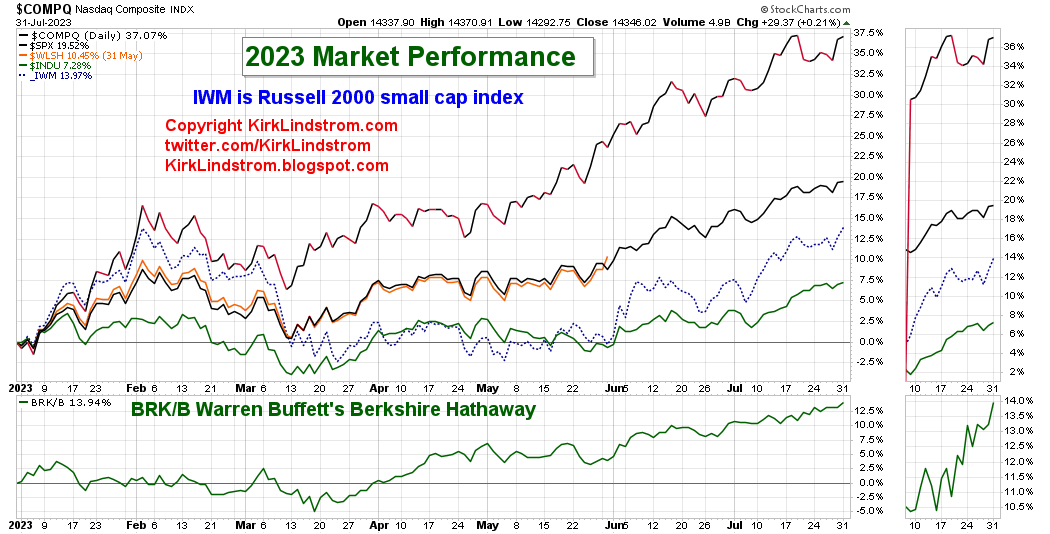
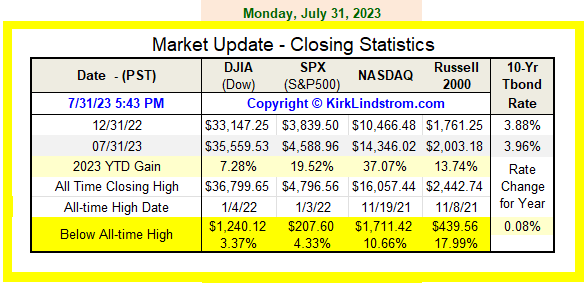
What a great year we've had now with seven months in the books. 
  • After a major bear market that bottomed in October of 2022, the four major indexes are mostly recovered to 3.4% to 18.0% below their record all-time highs.
  • My Explore Portfolio is just 0.1% below its record all-time high!
  • Inflation is running at 3.0% year-over-year while we are getting 5% in money market funds for a 2.0% positive real return!  
  • Finally, after what seems like decades, we are getting rewarded for saving money (ignoring taxes of course)!


FZDXX is "Fidelity Money Market Fund Premium Class"


To see what stocks and ETFs are in my "Explore Portfolio" and get a full list of on my price targets to both take profits or buy more:
 Subscribe NOW  and get
the
 July 2023 
Issue for FREE!!
(If you mention this ad)
x

Saturday, June 17, 2023

Market Update for June 17, 2023

 What a great year for bulls!


To see what stocks and ETFs are in my "Explore Portfolio" and get a full list of on my price targets to both take profits or buy more:
 Subscribe NOW  and get
the
 June 2023 
Issue for FREE!!
(If you mention this ad)

x

Saturday, May 28, 2022

Market Update - Nice Rebound Off Bear Market Low (so far?)

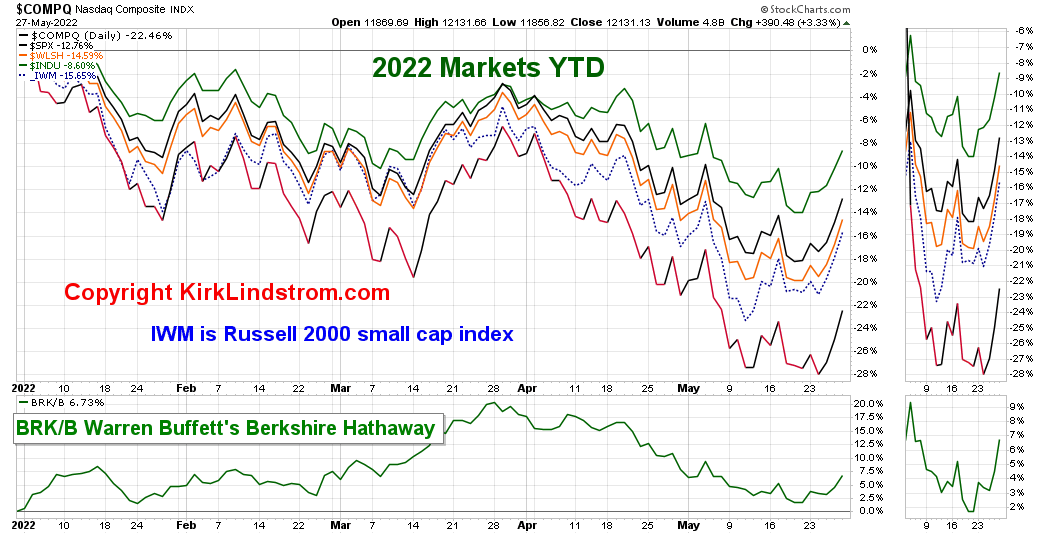
 As of Friday's close, the Nasdaq and Wilshire 2000 small cap indexes remain in bear markets while the S&P 500 has rallied off its bear market low back into "correction" territory while the Dow never reached the 20% down bear market threshold.

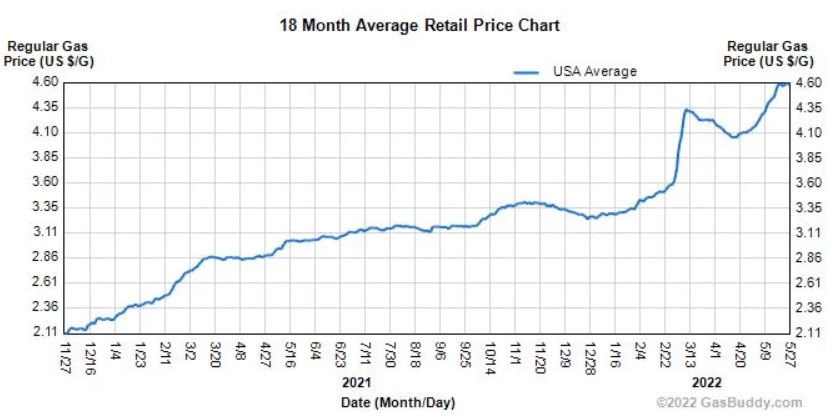
Interest rates have come down some but gasoline prices in some parts of California are OVER $7.00 a gallon!

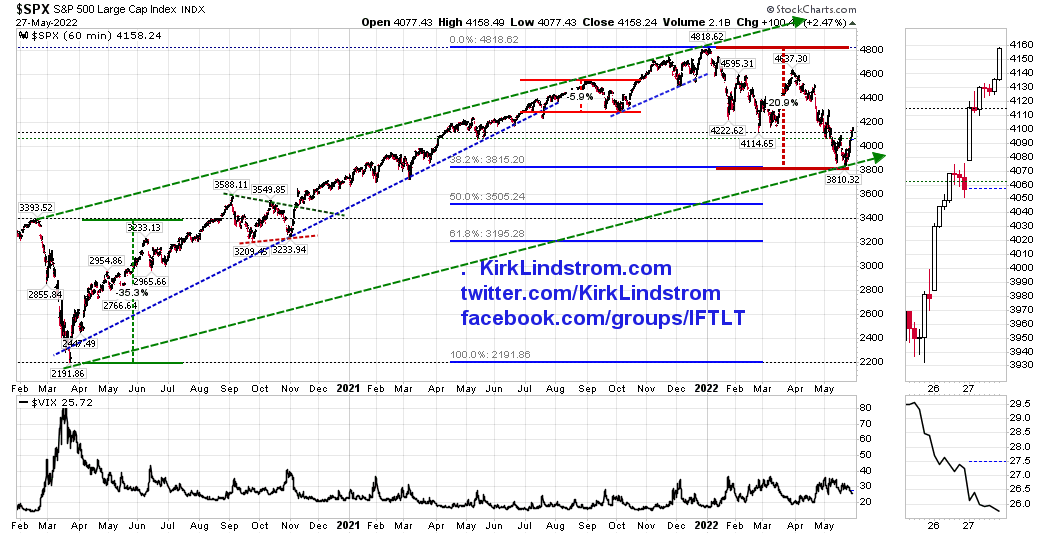
S&P 500 Observation:  Note how the recent 20.9% "bear market correction" kept the S&P 500 contained by the channel made by the much quicker, 35.3% COVID-19 bear market in 2020. 


Market Update for May 27, 2022

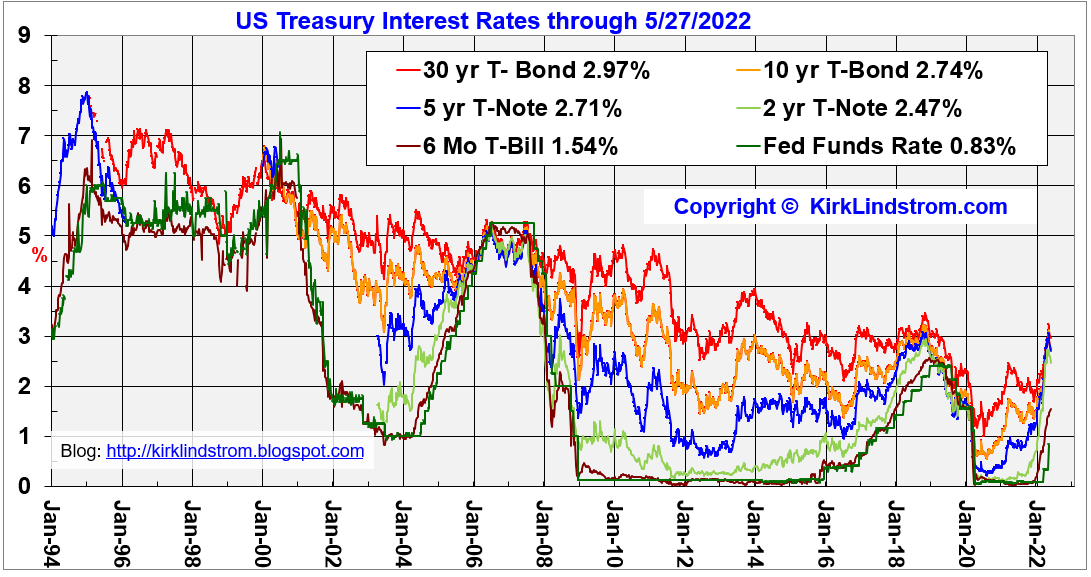
Interest Rates:  After spending some time above 3.00%, the 30-year and 10-year Treasury Bonds are now back below 3.00, perhaps an indication that inflation has peaked and the US economic growth is slowing, i.e. GDP growth is falling.

US Treasury Interest Rates Graph

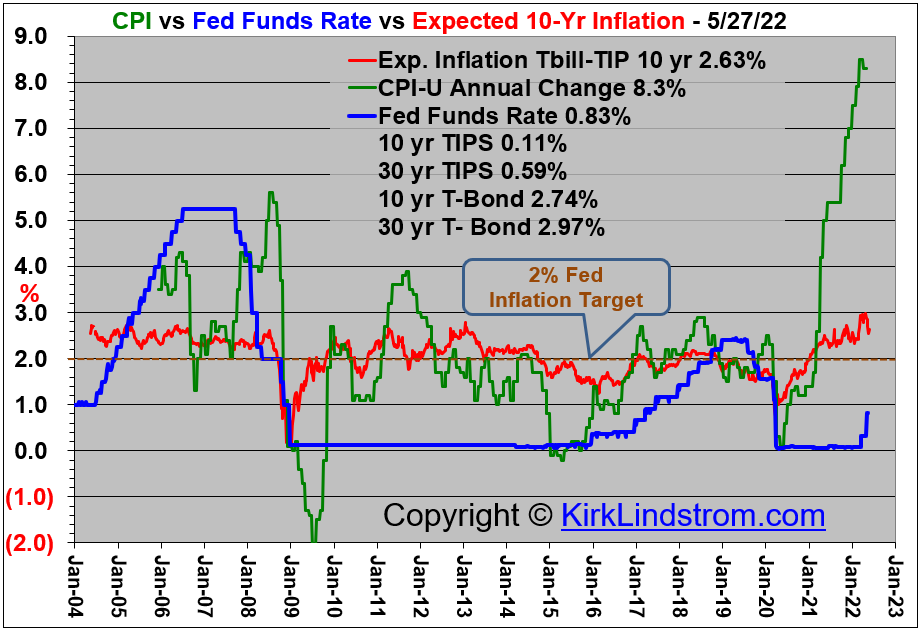
CPI vs Expected Inflation Rate

Average Gasoline Prices in the US
Gasoline Prices are higher here in California with many stations over $7 per gallon!
Sentiment Charts:
"Nasdaq New Highs - New Lows" 

CPC - Put:Call Ratio

Graph of the American Association of Individual Investors (AAII) Bulls Minus Bears Sentiment Indicator vs the Dow.
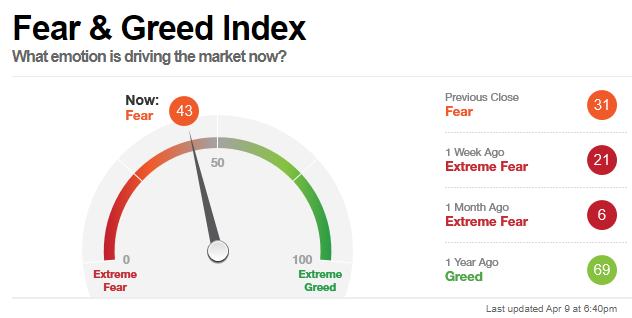
CNN Fear & Greed Index


Saturday, April 11, 2020

Best Week Since 1974 -Market Update 4/11/20

Market Update 4/11/20: For the Easter holiday-shortened week, the S&P 500 surged 12.1% for its biggest one-week gain since 1974, while the Dow rallied 12% and the Nasdaq jumped 10.6%. The S&P 500 (Chart #3 below) is well into a new bull market up nearly 29% off its bear market low.

It is shocking to see record bearish sentiment on many of the sentiment charts at the end and equally shocking how quickly we've recovered off the lows to a more "neutral" position.

For the year, the Dow, S&P 500 and Nasdaq are down 16.9%, 13.7% and 9.1% respectively with the Russell 2000 still in bear territory down 25.3% YTD .


After falling 36% to a bear market low of 2,191.86, the S&P 500 has rallied 29% to a new, cyclical bull market high while covering just over 50% of its loss from the peak.

While the the Dow, S&P 500 and Nasdaq are now down less than 20% from their peaks, the Russell 2000 trails significantly at down 28.4%.

Hopefully you raised cash like I did in my newsletter to have funds to buy back some of what we sold at much lower prices.

Intel (INTC) is one of the "great trading stocks" I cover in "Kirk Lindstrom's Investment Letter" where I trade Intel around core positions.
I took profits in January at $66.57 then used the bear market decline to buy the shares back at a $14.65 discount ($66.57-$51.92=$14.65) in March.
Here is a copy of the email alert I sent my subscribers to REMIND them Intel reached the price I published in the newsletter for buying shares back.

More Intel charts.  The second chart at that link has a very cool AI (Artificial Intelligence) feature that draws resistance and support lines on the one-year graph.


During the COVID-19 Bear Market Decline, I added to 15 of the 17 individual "issues" I cover in my newsletter for "Kirk's Explore Portfolio." That was a record as typically there are only one or two buys or sells during a month. I haven't worked so hard to send out alerts and update my newsletter with new target prices (listed on the full page coverage of each individual issue with a summary of all buy and sell prices updated on page 5 of each newsletter) since I started the newsletter in 1998! Order a Free Sample Issue if you wish to see what this looks like.
Now with the great, big rally from the bottom, we are very, very close to my "take profits" points for many of these stocks. Some are still closer to the buy points so it is not too late either. IF this turns out to be a long, secular bear market with cyclical bull market rallies, then I should continue to profit from that volatility.

Kirk Lindstrom's Investment Letter
Don't miss out!
 Get April Issue For Free!

Here are a few, important investor sentiment charts that I cover in my newsletter. You can see there was record fear at the bottom of this bear market before the current bull market started.


Come discuss this article and more on my Facebook "Investing for the Long Term" group!

Saturday, February 09, 2019

Is This a New Bull Market or Bear Market Rally?

The rally since the Christmas bear market lows has been large and fast.  
The question all want to know and that gets extensive debate on message board is: 
Is this a new bull market that will make new highs soon or are we in a bear market rally that will roll over soon and lead us to new lows?


While the major indexes are still down 6.4% to 13.5% from their 2018 record highs, they are up between 7.6% and 11.7% already this year.
All four hourly index charts above show that indexes rallied above an "inverted head and shoulder bottom pattern" then pulled back this week to test that breakout or neckline from above.  If that neckline holds and the indexes continue to rally higher, then the odds favor new highs for most of the indexes.  The green line with an arrow head on the Russell 2000 chart shows the target of the pattern is below its 2018 high while the Dow pattern has a target of a new high.

My Explore Portfolio made several record highs before pulling back slightly Friday.  It really helped to be taking profits last year when the market was at record highs then buying stocks near the Christmas Bear Market Lows.  The types of stocks in my Explore Portfolio usually lead out of bear market bottoms and now is no exception so this is also bullish.


 Subscribe NOW and get the February 2019 Issue for FREE!!!
This "Andrew's Pitchfork" chart of the S&P 500 show two possible scenarios.

  1. The red "bearish pitchfork" suggests the rally is over or nearly over while 
  2. the green "bullish pitchfork" suggests the rally is only about half way to its peak.

Only time will tell since nobody knows for sure what the markets will do in the short term.  I've taken some profits on what I bought near the lows last year so I have plenty of cash to buy if the markets test their Christmas lows or even go lower.  Also, I have plenty in the market and will just take more profits if the markets continue high.  As my results from on the record for over 20 years show, I don't need to be "right" about the short term market direction as my method works best with some volatility.

To understand more, please read these KEY articles:
Discuss this article on my "Investing for the long term" Facebook group. 

.

Followers - Click "follow" to get an email alert for new articles

Kirk Lindstrom's Investment Letter Performance