Don't Miss Out On Great Gains! - Best Investment Newsletter


Click for FREE sample of Kirk Lindstrom's Investment Letter

Don't miss out! Subscribe Now

google.com, pub-7001134751860982, DIRECT, f08c47fec0942fa0

Search For More

Showing posts with label Bear Market. Show all posts

Friday, March 03, 2023

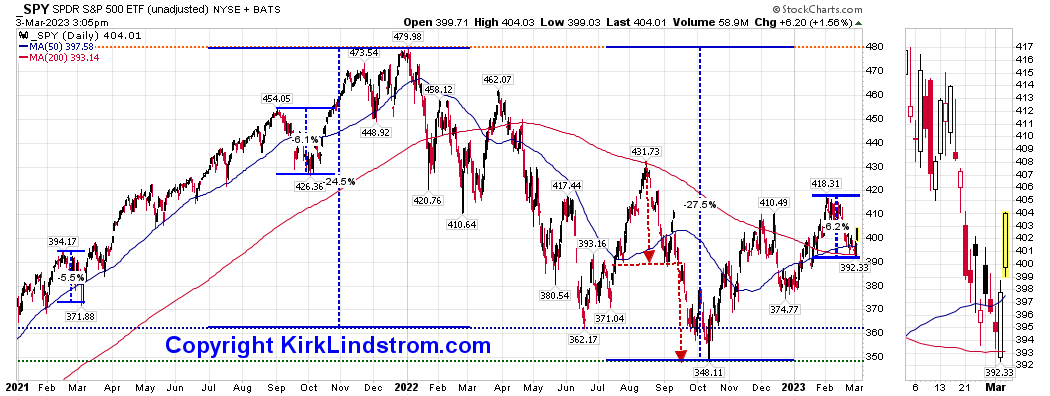
SPY Declines by Year Since 2007

 SPY (Live SPY chartsBear Markets and Intraday Corrections since 2007 Market Peak

This current decline, if over, just slightly exceeded the biggest decline in 2021!


After the 2007 to 2009 bear market, I started tracking SPY for my newsletter so I can quickly see returns with and without reinvested dividends using charting services that show returns with and without reinvested dividends.


Kirk Lindstrom's Investment Letter
To see what stocks and ETFs are in my "Explore Portfolio" and get a full list of on my price targets to both take profits or buy more:
 Subscribe NOW  and get
the
 February 2023 
Issue for FREE!!
(If you mention this ad)
Reminder, you can subscribe to this feed for free to get sent emails by Google when I post new charts and articles. Just click "Follow" below.

Sunday, October 16, 2022

Worst Inflation in 40 Years - Bear Market Continues

The bear market that began at the start of the year continues with all four major markets I follow down over 20% from their peaks.


It is hard to get excited about the economy when gasoline in CA is over $7 per gallon for regular in many areas with the "cheap stations" in the Silicon Valley over $6.00 per gallon.


🌡CPI up 8.2% in September📈🔥


Kirk Lindstrom's Investment Letter

To see what stocks and ETFs are on my buy list and what are my price targets:
 Subscribe NOW  and get
the
 October 2022 
Issue for FREE!!!
(If you mention this ad)

Friday, October 07, 2022

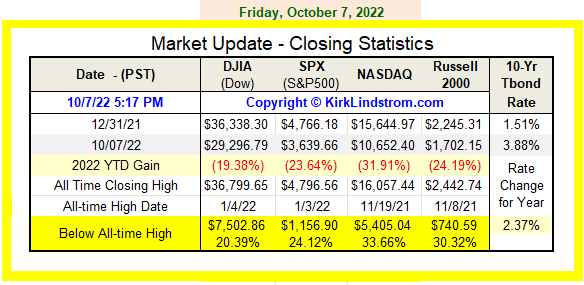
Market Update - The Bear Market Continues

The bear market that began at the start of the year continues with all four major markets I follow down over 20% from their peaks.


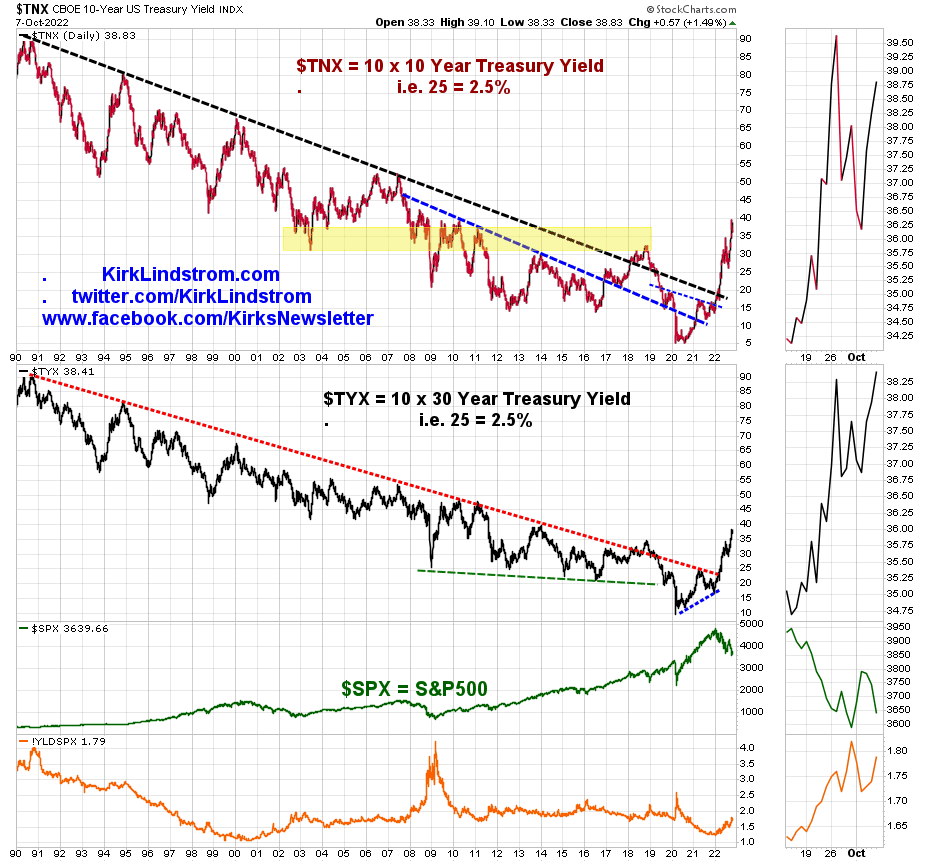
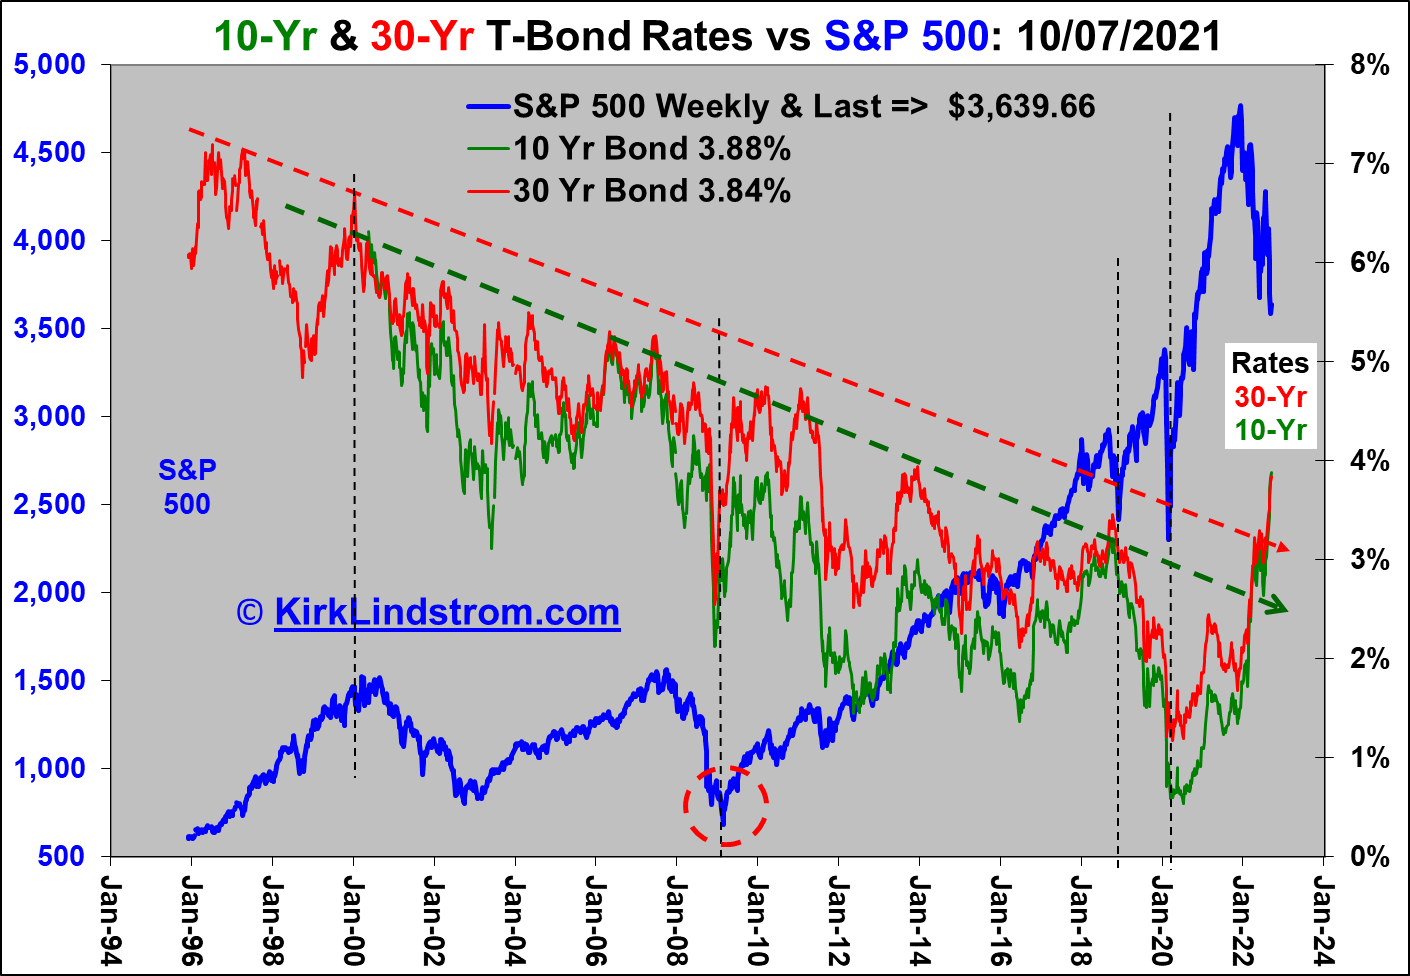
Interest rates continue to rise.  Mortgage rates broke above 7% while the 10-year US Treasury, just below 4.0%, is near its high in over a decade.


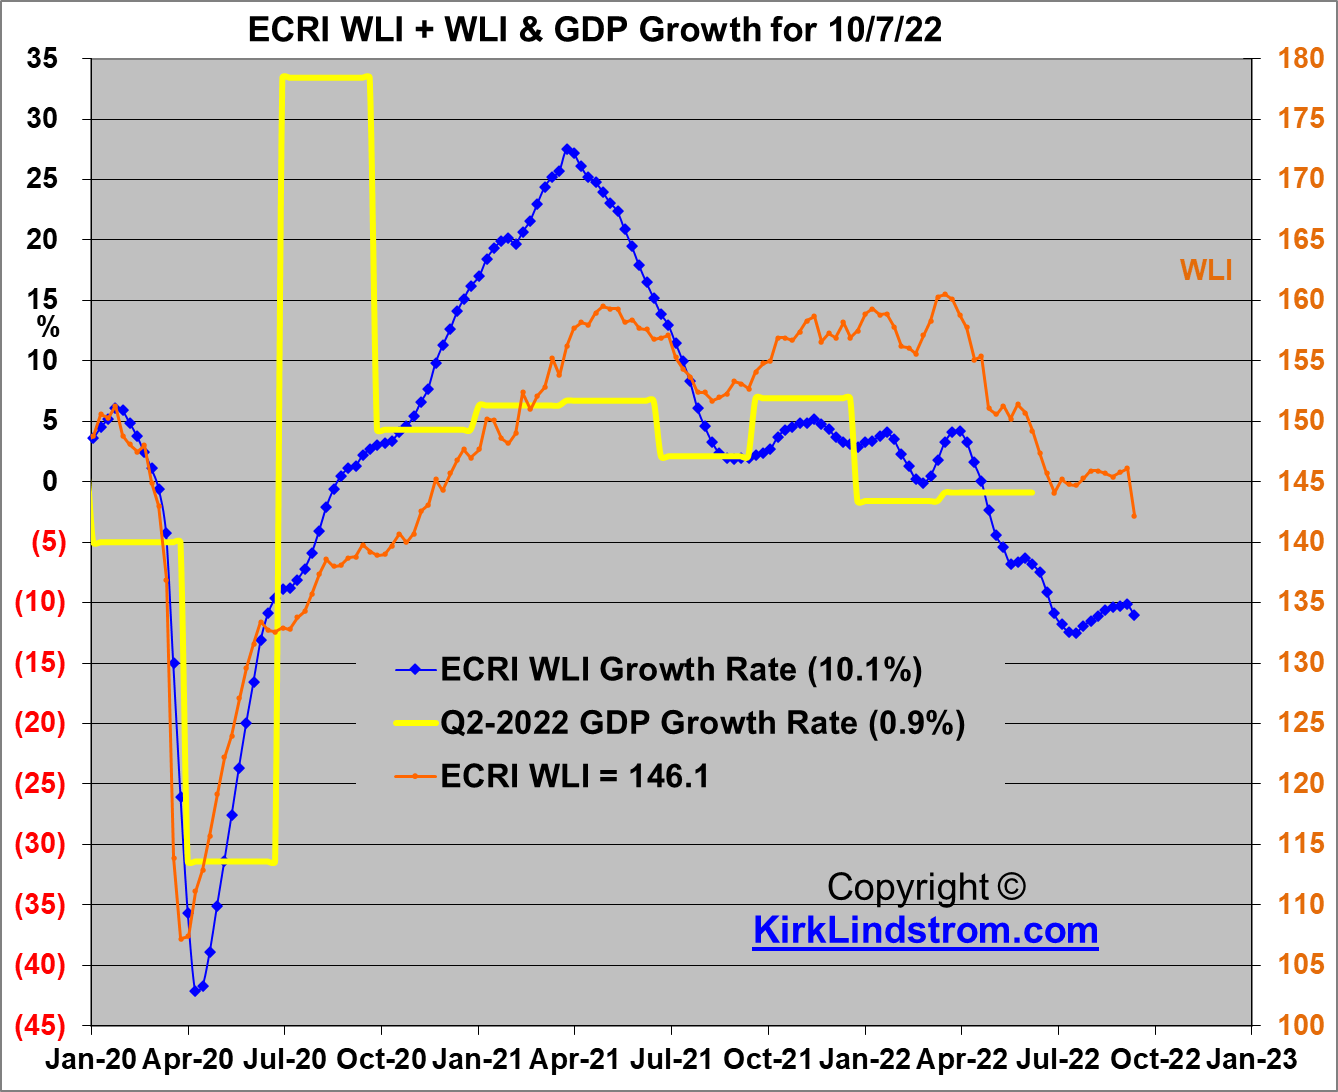
For many weeks, ECRI"s Weekly Leading Index, WLI, had given some hope as it slowly worked higher, but this week saw the reading for 9/30/22 fall off a cliff on the day the markets made their lows for the year. 
ECRI's WLI, WLI Growth Rate & Quarterly GDP Growth Graph. 
$SPX $SPY $DIA $QQQ


US Stock Markets (Log Scale) vs. Fed Funds Rate 


10-Yr & 30-Yr T-Bond Rates vs S&P 500
 $TNX $TYX $SPX $SPY #InterestRates #Treasury Rates


Kirk Lindstrom's Investment Letter

To see what stocks and ETFs are on my buy list and what are my price targets:
 Subscribe NOW  and get
the
 October 2022 
Issue for FREE!!!
(If you mention this ad)


Saturday, October 01, 2022

Market Update - A Brutal September is OVER!

Market Update through September 30, 2022

📉🐻The first three quarters of 2022 saw all four major stock market indexes reach bear market levels.


Market in September fell 8.8% to 10.5%

The S&P 500 and Nasdaq have given back all their gains for nearly two years


The DJIA and Wilshire 2000 small cap index have done much worse, surrendering gains back to before the pandemic began in March 2000! 


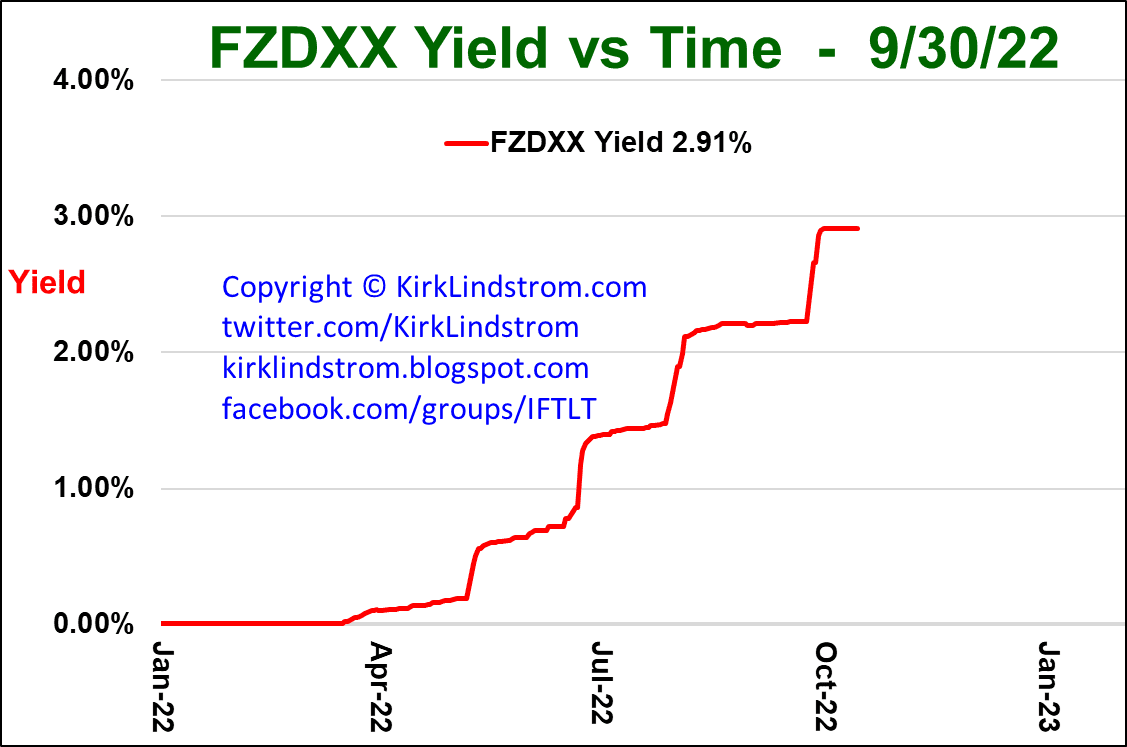
Due to my profit taking, positions in cash (FZDXX) and iBonds plus some dip buying then profit taking in the August rally, my "Explore Portfolio" is ahead of the S&P 500 this year by 5.4%. But, I'm still down which never feels good.  Of course I have a huge advantage over the "buy and hold forever" crowd that didn't raise any cash during the record highs to use now to buy stocks back at much lower prices.  


The good news is with TIAA (There is an Alternative) now in that short term money funds pay a decent return but they are still getting crushed by inflation, which is where my iBonds are helping.  See Current Rates for New & Older I Bonds

From Bloomberg: BofA Strategists See Wall Street Rout Forcing Asset Sales

...accumulated losses could be forcing funds to sell more assets to raise cash, accelerating the selloff, according to Bank of America. 

... Stocks are falling again Friday, with the S&P 500 heading toward its third straight quarter of losses for the first time since 2009 and the Nasdaq 100 Stock Index for the first time in 20 years. 

...BofA strategists said to “bite” into the S&P 500 at the 3,300 level -- about a 9% decline from the latest close, “nibble” at 3,600 and “gorge” at 3,000. Hartnett and his team added that a drop of 20% below 200-day moving average has been a good entry point back into stocks in the past 100 years.


If BofA is correct about a looming liquidation event that will drive the market even lower for a massive buying opportunity, then some of the buy limit orders published on page 5 of my newsletter will probably be reached!

But if not and the bottom is in, we've already started buying back shares at these much lower prices than were I took profits. 

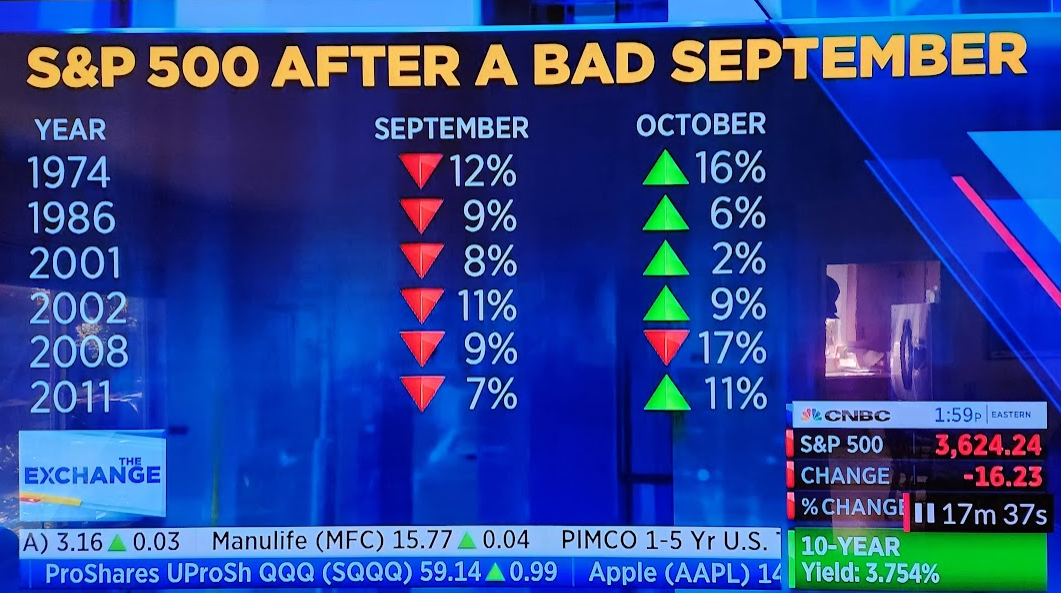
This graphic suggests the odds are favorable for a good October.

Make sure you take my poll on Facebook: 

Whatever happens, I hope you are ready and have a plan!

To see my plan, what stocks and ETFs are on my buy list and what are my price targets:
 Subscribe NOW  and get
the
 September 2022 
Issue for FREE!!!
(If you mention this ad)

Saturday, May 28, 2022

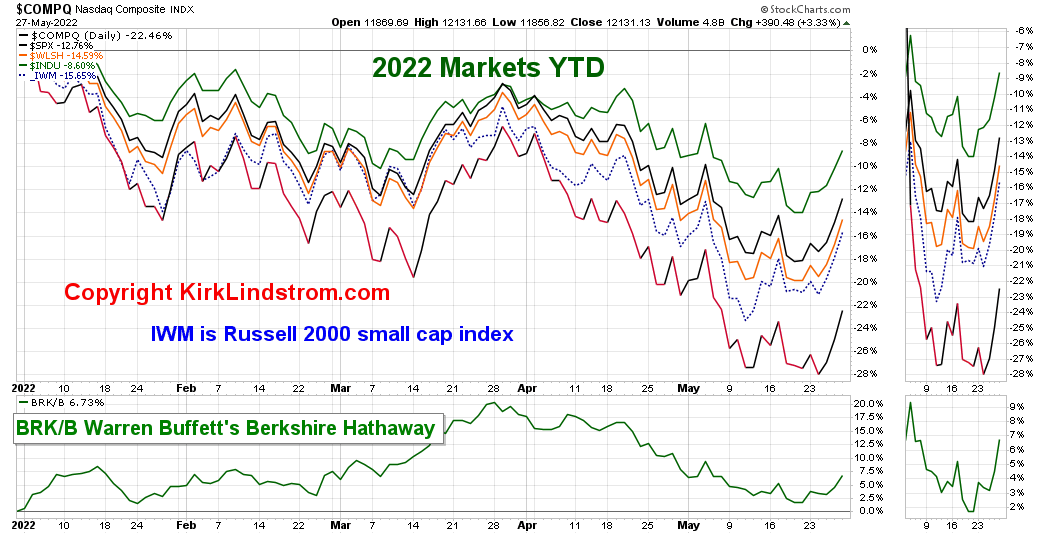
Market Update - Nice Rebound Off Bear Market Low (so far?)

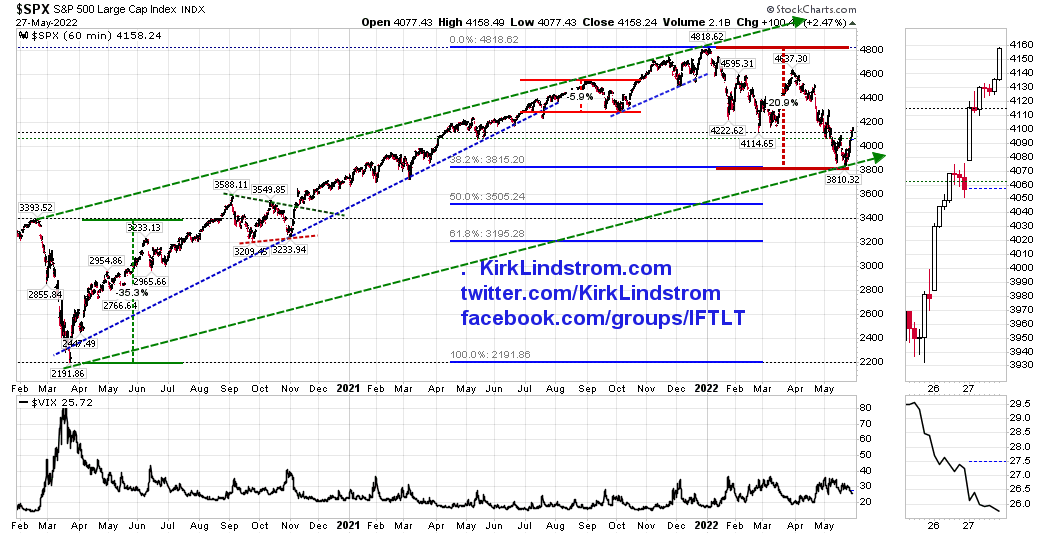
 As of Friday's close, the Nasdaq and Wilshire 2000 small cap indexes remain in bear markets while the S&P 500 has rallied off its bear market low back into "correction" territory while the Dow never reached the 20% down bear market threshold.

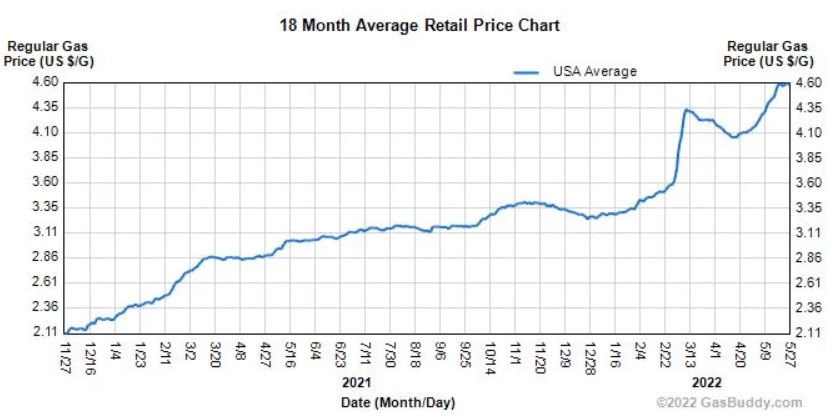
Interest rates have come down some but gasoline prices in some parts of California are OVER $7.00 a gallon!

S&P 500 Observation:  Note how the recent 20.9% "bear market correction" kept the S&P 500 contained by the channel made by the much quicker, 35.3% COVID-19 bear market in 2020. 


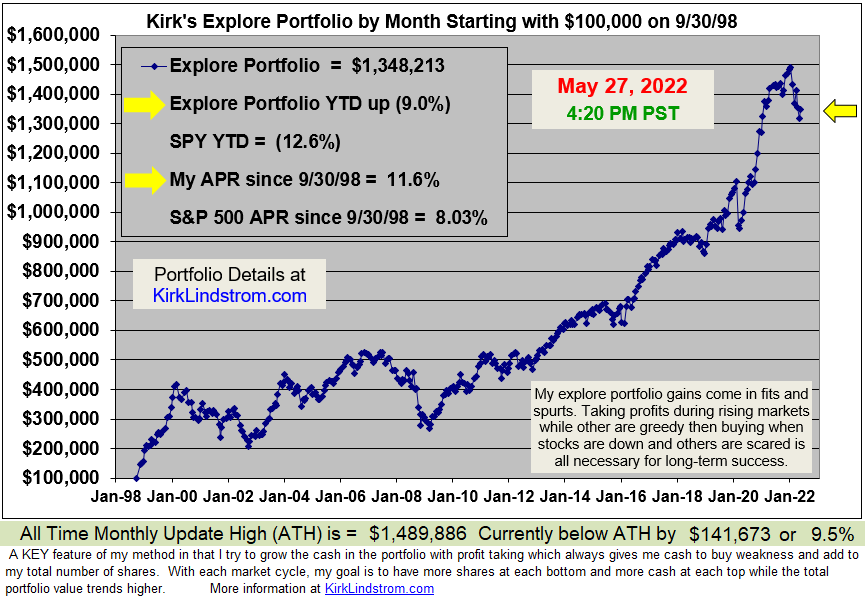
Market Update for May 27, 2022

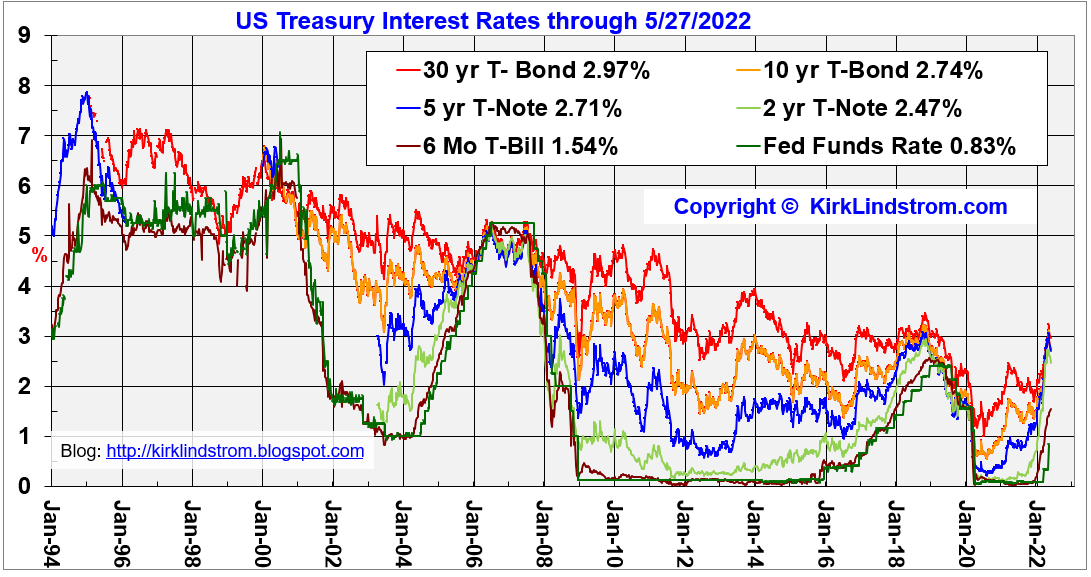
Interest Rates:  After spending some time above 3.00%, the 30-year and 10-year Treasury Bonds are now back below 3.00, perhaps an indication that inflation has peaked and the US economic growth is slowing, i.e. GDP growth is falling.

US Treasury Interest Rates Graph

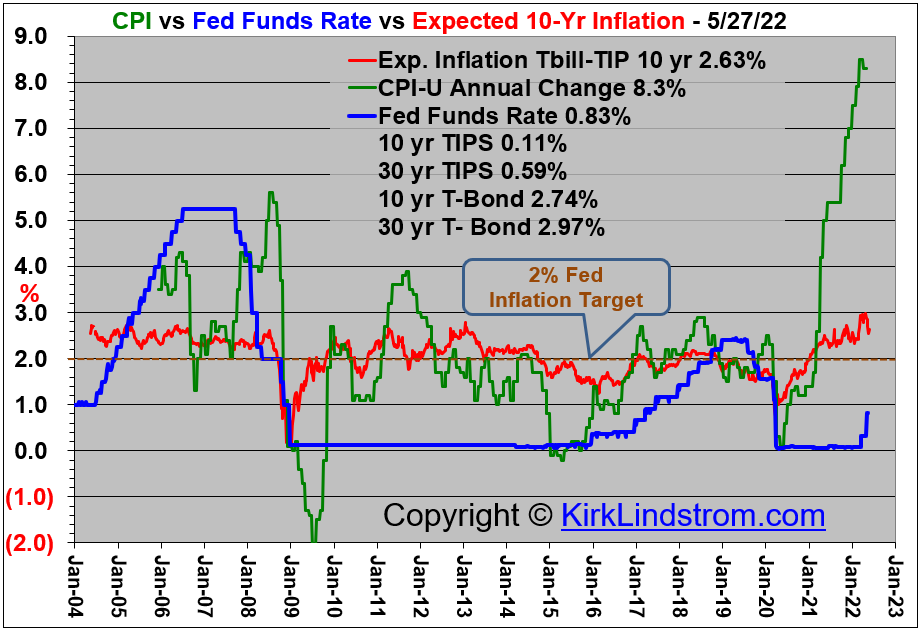
CPI vs Expected Inflation Rate

Average Gasoline Prices in the US
Gasoline Prices are higher here in California with many stations over $7 per gallon!
Sentiment Charts:
"Nasdaq New Highs - New Lows" 

CPC - Put:Call Ratio

Graph of the American Association of Individual Investors (AAII) Bulls Minus Bears Sentiment Indicator vs the Dow.
CNN Fear & Greed Index


Followers - Click "follow" to get an email alert for new articles

Kirk Lindstrom's Investment Letter Performance