Don't Miss Out On Great Gains! - Best Investment Newsletter


Click for FREE sample of Kirk Lindstrom's Investment Letter

Don't miss out! Subscribe Now

google.com, pub-7001134751860982, DIRECT, f08c47fec0942fa0

Search For More

Thursday, June 29, 2023

Kirk's Investor Sentiment Charts & Data

 🐂📈Kirk Lindstrom's Investor Bull/Bear Sentiment Charts for 6/29/23 📉🐻

Reminder, you can subscribe or follow this feed and get sent emails by Google when I post new charts and articles. Just click "Follow" below.

II Investors Intelligence & AAII (American Association of Individual Investors) Sentiment Updates.
Graphs best views full screen.

II Bulls and Bears Sentiment Graphs


AAII Bulls and Bears Sentiment Graphs: The AAII Investor Sentiment Survey measures the percentage of individual investors who are bullish, bearish, and neutral on the stock market for the next six months.


These charts are covered on page 6 of my newsletter with updates during the year for what the different types of sentiment charts mean to me. This is an easy place to give my subscribers updates of charts too numerous to add each month I cover.

To see what stocks and ETFs are in my "Explore Portfolio" and get a full list of on my price targets to both take profits or buy more:
 Subscribe NOW  and get
the
 June 2023 
Issue for FREE!!
(If you mention this ad)


Saturday, June 24, 2023

LIBOR Rates

LIBOR Rates are near decade highs

Chart of LIBOR Rates from 1993 to 6/24/23

When rates were high and falling, I used to get hybrid loans that were fixed for one to five years then variable for the next 30 years. 

Back when rates were under 4% for 30-year loans, I recommended replacing these risky, variable rate loans with fixed rate loans.

In 2011, I ate my cooking and refinanced my 30 year LIBOR plus 1.25% loan with a 15-year, fixed rate mortgage at 3.375%. For a few years, LIBOR kept falling and it would have been cheaper to stay with the variable loan but now I'm paying less than inflation, the cash to pay it off is in Series I bonds making inflation plus as much as 3.0%

As this article notes, LIBOR was phased out in 2021 for setting loan rates.

From Wikipedia 

The London Inter-Bank Offered Rate is an interest rate average calculated from estimates submitted by the leading banks in London. Each bank estimates what it would be charged were it to borrow from other banks. It is the primary benchmark, along with the Euribor, for short-term interest rates around the world. Libor was phased out at the end of 2021, and market participants are being encouraged to transition to risk-free interest rates such as SOFR and SARON.

As of late 2022, parts of it have been discontinued, and the rest is scheduled to end within 2023; the Secured Overnight Financing Rate (SOFR) is its replacement. 

Libor rates are calculated for five currencies and seven borrowing periods ranging from overnight to one year and are published each business day by Thomson Reuters. Many financial institutions, mortgage lenders, and credit card agencies set their own rates relative to it. At least $350 trillion in derivatives and other financial products are tied to Libor.


To see what stocks, ETFs and fixed income investments are in my "Explore Portfolio" and get a full list of on my price targets to take profits or buy more:
 Subscribe NOW  and get
the
 June 2023 
Issue for FREE!!
(If you mention this ad)
More about Series I Bonds
x

Saturday, June 17, 2023

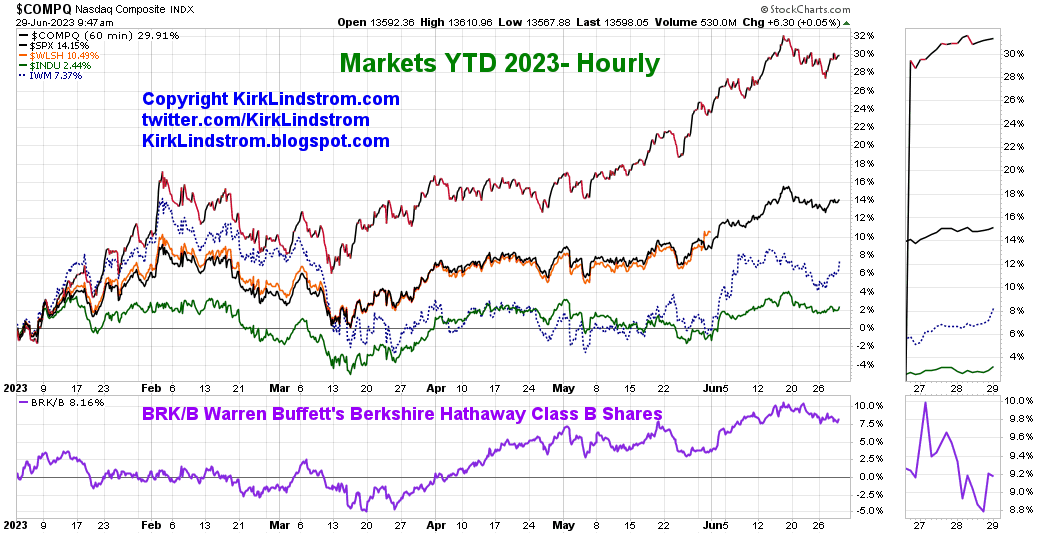
Market Update for June 17, 2023

 What a great year for bulls!


To see what stocks and ETFs are in my "Explore Portfolio" and get a full list of on my price targets to both take profits or buy more:
 Subscribe NOW  and get
the
 June 2023 
Issue for FREE!!
(If you mention this ad)

x

Tuesday, June 13, 2023

Treasury Revenue Falls, Spending Rises and Deficit Soars

6/13/23 Updated Summary of Receipts, Outlays, and the Deficit/Surplus of the U.S. Government by Month.: 

Key Points:

  • For FY 2023, total taxes and other revenues collected YTD are down 11.3% year-over-year.  
  • Just as big a "problem" is SPENDING grew 9.4%!  
  • Spending is up about 5.4% above the 4.0% year over year CPI inflation rate reported this morning.
  • The deficit is up 27.1% in just a year!
This table shows a summary of receipts, outlays, and the deficit for the U.S. Government by Month.


To see what stocks and ETFs are in my "Explore Portfolio" and get a full list of on my price targets to both take profits or buy more:
 Subscribe NOW  and get
the
 June 2023 
Issue for FREE!!
(If you mention this ad)
x

Thursday, June 08, 2023

Kirk's Investor Sentiment Charts & Data

 🐂📈Kirk Lindstrom's Investor Bull/Bear Sentiment Charts for 6/8/23 📉🐻

Reminder, you can subscribe or follow this feed and get sent emails by Google when I post new charts and articles. Just click "Follow" below.

II Investors Intelligence & AAII (American Association of Individual Investors) Sentiment Updates.
Graphs best views full screen.

II Bulls and Bears Sentiment Graphs


AAII Bulls and Bears Sentiment Graphs: The AAII Investor Sentiment Survey measures the percentage of individual investors who are bullish, bearish, and neutral on the stock market for the next six months.


AAII Data at https://www.aaii.com/sentimentsurvey

More: 
Kirk Lindstrom's Investment Letter

To see what stocks and ETFs are in my "Explore Portfolio" and get a full list of on my price targets to both take profits or buy more:
 Subscribe NOW  and get
the
 June 2023 
Issue for FREE!!
(If you mention this ad)


x

Followers - Click "follow" to get an email alert for new articles

Kirk Lindstrom's Investment Letter Performance