
Here is a graph of the STAX Schwab Trading Activity Index Over Time, from January 2019 through Today.
Note that even with the markets at record highs last week, the STAX remains closer to a 6-year low than a 6-year high.
Click Images to See Full Size
Best in Full Screen


US Stock Markets (Log Scale) vs. Fed Funds Rate

II Sentiment: Investors Intelligence Bulls / (Bulls+Bears) & S&P 500 Weekly


Kirk Lindstrom's Investment Letter
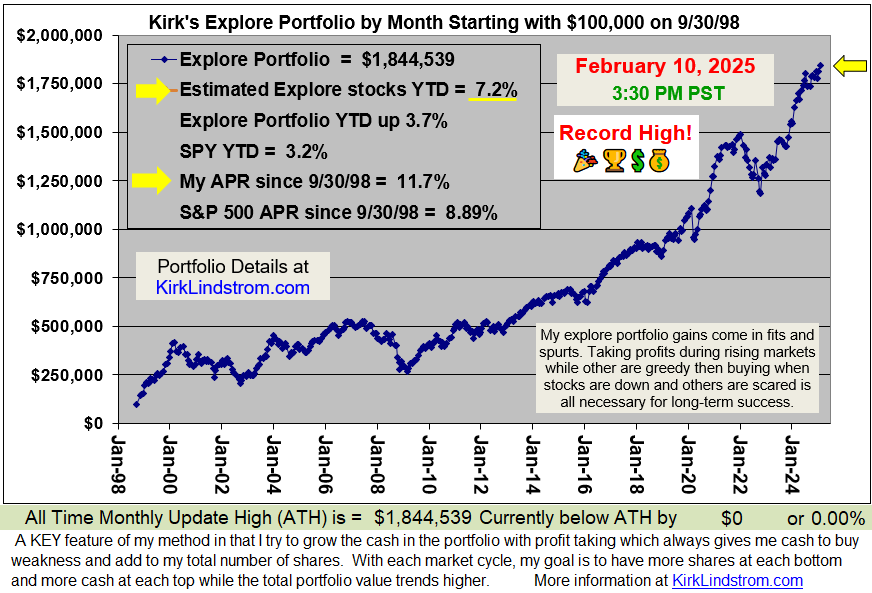
To see what stocks and ETFs are in my "Explore Portfolio" and get a full list of on my price targets to both take profits or buy more:
Subscribe NOW and get
the February 2025 Issue for FREE!!!
(If you mention this ad)
the February 2025 Issue for FREE!!!
(If you mention this ad)


 kirklindstrom.com

No comments:
Post a Comment