
Schwab Trading Activity Index, also known as STAX, remains low despite the S&P 500 and Nasdaq markets sitting less than 1% below their record closing highs.
Here is a graph of the STAX Schwab Trading Activity Index Over Time, from January 2019 through Today.
Note that even with the markets near record highs, STAX remains closer to a 6-year low than a 6-year high.
Click Images to See Full Size Images
Best in Full Screen
Best in Full Screen
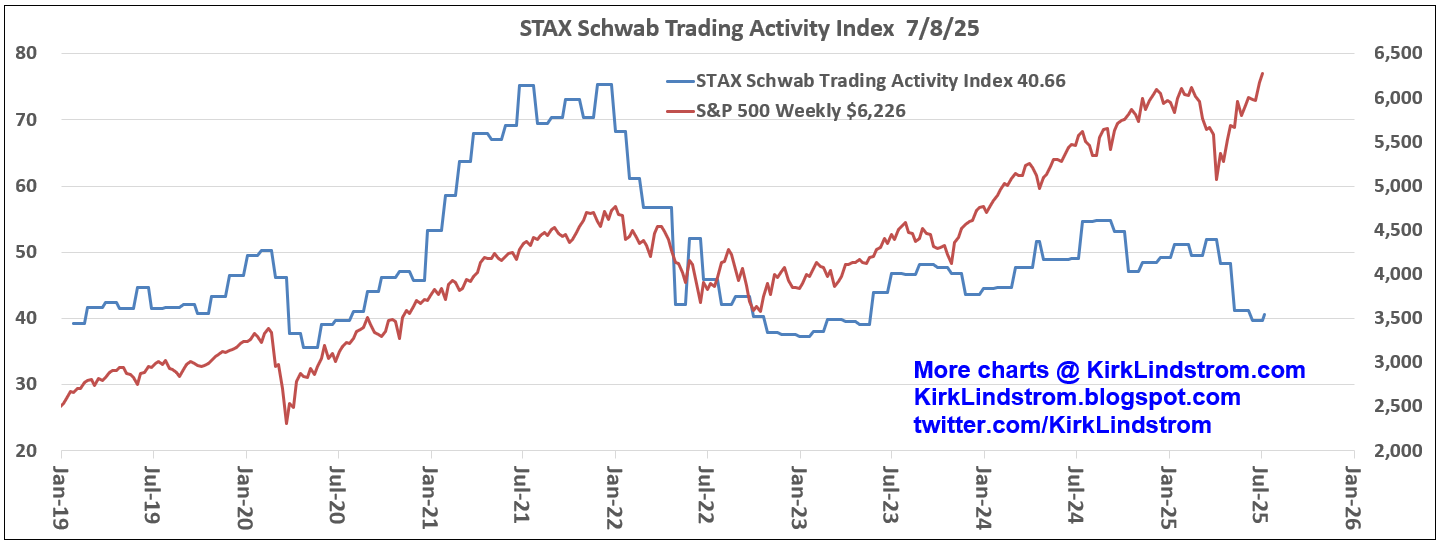 |
| Schwab Trading Activity Index |
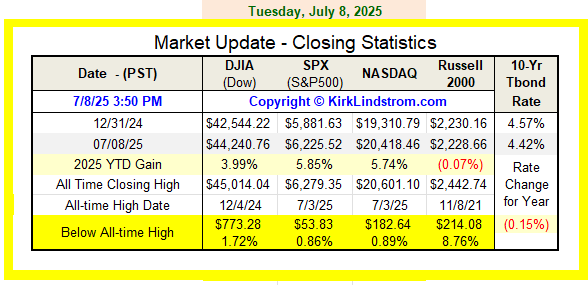 |
| Market Update |
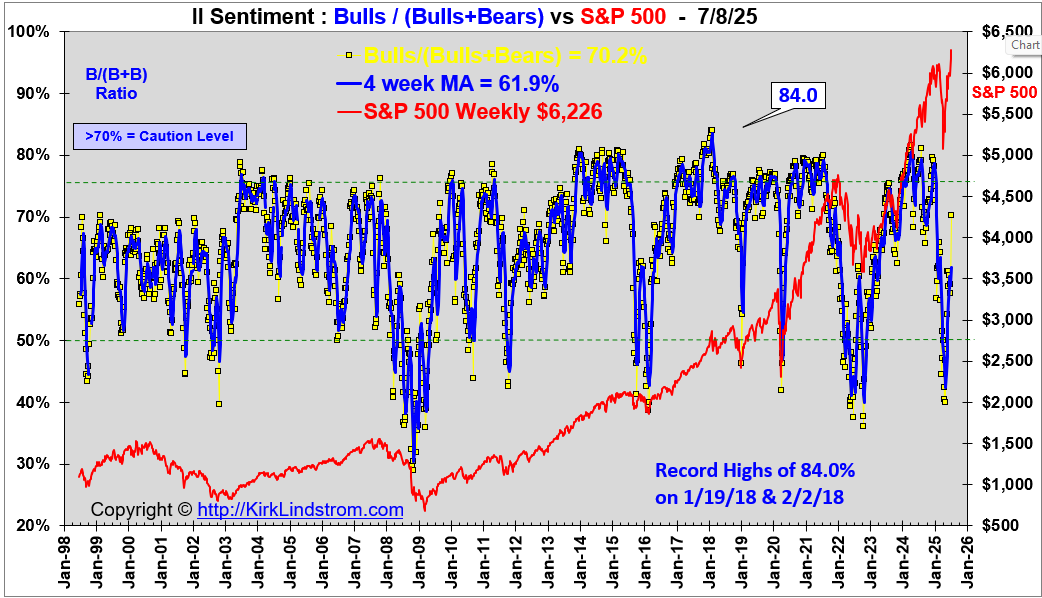 |
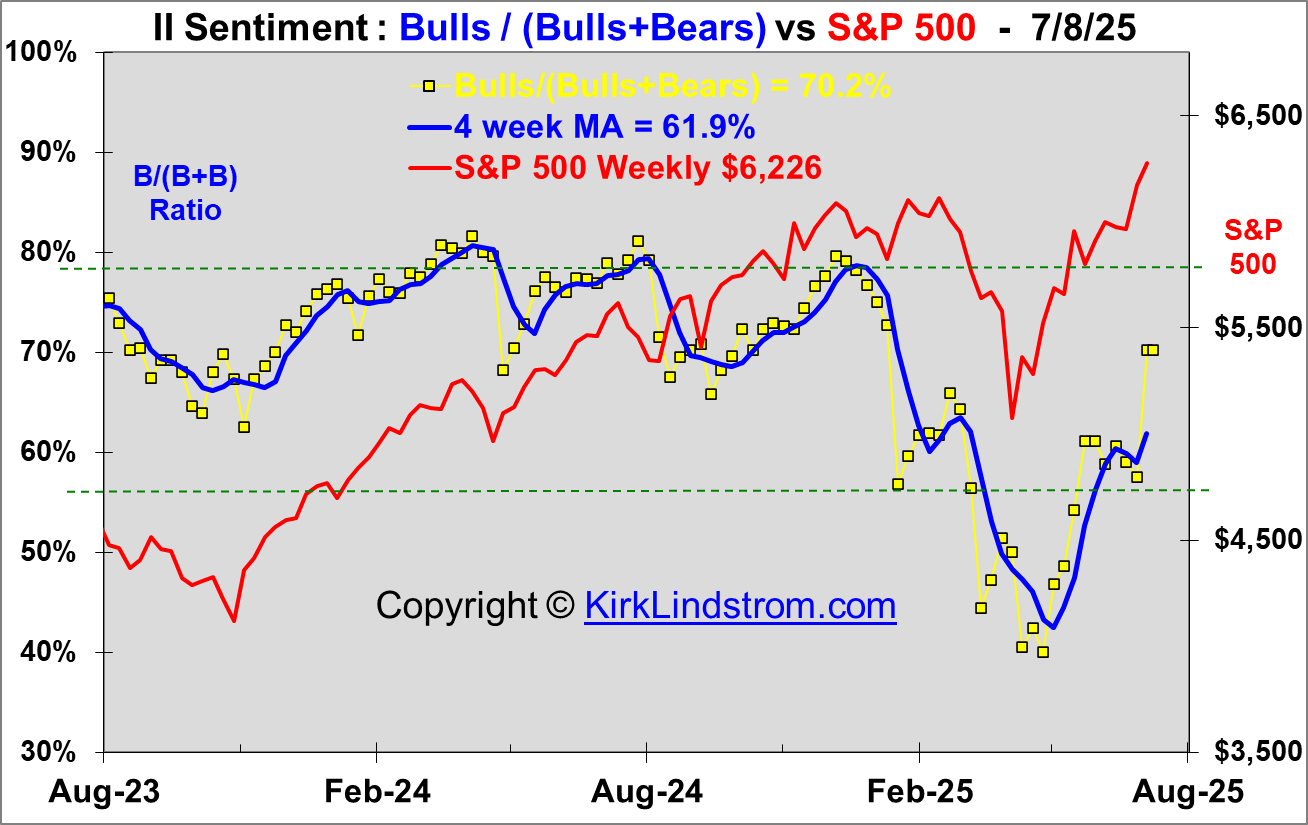
| II Bulls Over Bulls Plus Bears 1998 to Now |
Kirk Lindstrom's Investment Letter


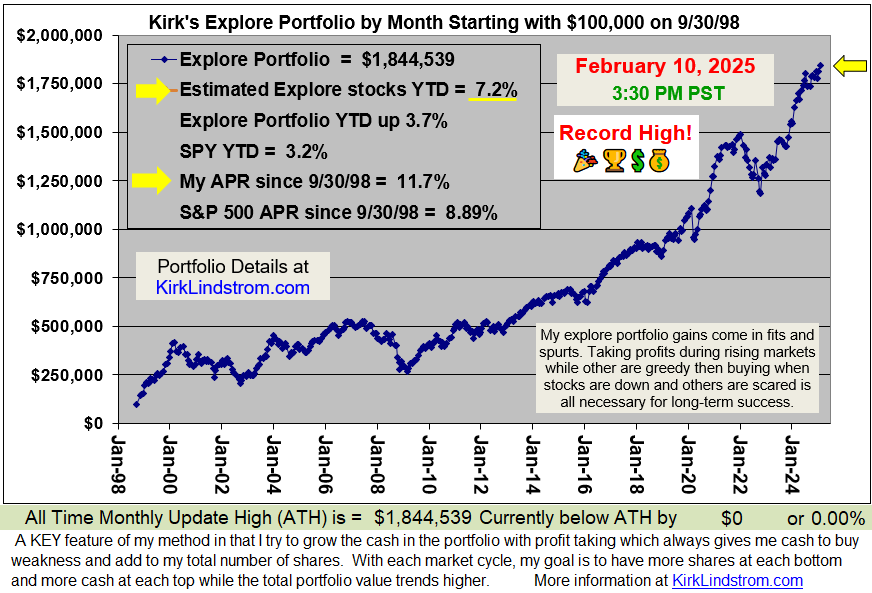
To see what stocks and ETFs are in my "Explore Portfolio" and get a full list of on my price targets to both take profits or buy more:
Subscribe NOW and get
the July 2025 Issue for FREE!!!
(If you mention this ad)
the July 2025 Issue for FREE!!!
(If you mention this ad)






 Posts
Posts


 kirklindstrom.com
