Don't Miss Out On Great Gains! - Best Investment Newsletter


Click for FREE sample of Kirk Lindstrom's Investment Letter

Don't miss out! Subscribe Now

google.com, pub-7001134751860982, DIRECT, f08c47fec0942fa0

Search For More

Showing posts with label Bradley Turn Dates. Show all posts

Sunday, November 23, 2025

Bradley Turn Points Jul thru Dec 2025

 Bradley Turn Points - Bradley Dates July 2025 through December 31, 2025


Compliments of Breeze 


Monday, February 01, 2010

Donald Bradley Turn Dates for 2010

Amanita Forecasting's Bradley Turn Dates for 2010. Amanita Forecasting uses the "Bradley Siderograph" and astrology to predict major market turns. It does not predict the direction.


The Bradley siderograph (more information) was developed in the 1940's by Donald Bradley to forecast the stock markets. Bradley assigned numerical values to certain planetary constellations for every day, and the sum is the siderograph. It was originally intended to predict the stock markets. William Eng, a noted technical analyst, singled out the Bradley as the only 'excellent' Timing Indicator in his book, "Technical Analysis of Stocks, Options, and Futures" (source: Astrikos).


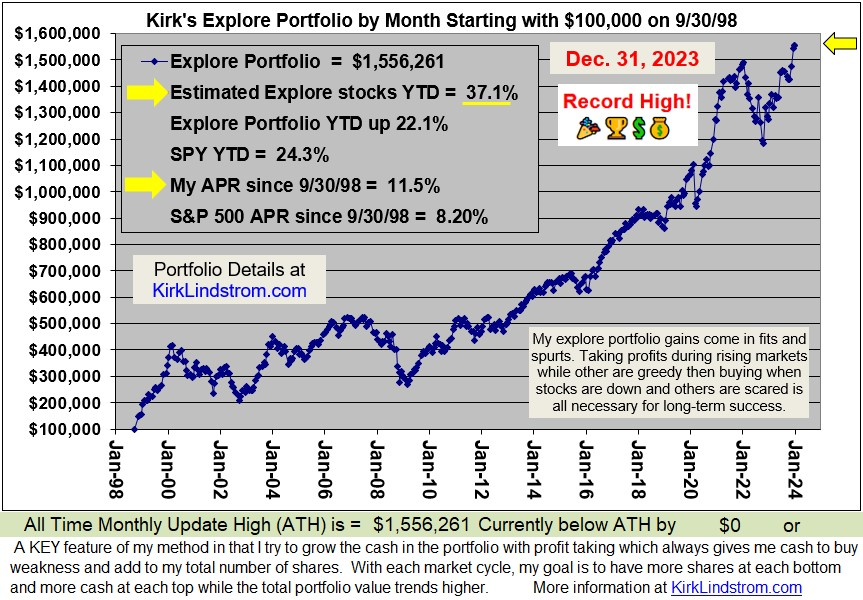
Since 12/31/98 "Kirk's Newsletter Explore Portfolio" is UP 159% (a double plus another 59%!!) vs. the S&P500 UP a tiny 8.6% vs. NASDAQ UP a tiny 3.5% (All through 12/31/09)

As of December 31, 2009, "Kirk's Newsletter Explore Portfolio" is up 33.5% YTD vs. DJIA up 18.8% YTD


More info about Bradley at:

Sunday, November 16, 2008

Donald Bradley Turn Dates for 2009

Amanita Forecasting has announced the Bradley Turn Dates for 2009 and the remainder of 2008. Amanita Forecasting uses the "Bradley Siderograph" and astrology to predict major market turns. It does not predict the direction.


The Bradley siderograph (more information) was developed in the 1940's by Donald Bradley to forecast the stock markets. Bradley assigned numerical values to certain planetary constellations for every day, and the sum is the siderograph. It was originally intended to predict the stock markets. William Eng, a noted technical analyst, singled out the Bradley as the only 'excellent' Timing Indicator in his book, "Technical Analysis of Stocks, Options, and Futures" (source: Astrikos).


Since 12/31/98 "Kirk's Newsletter Explore Portfolio" is UP 159% (a double plus another 59%!!) vs. the S&P500 UP a tiny 8.6% vs. NASDAQ UP a tiny 3.5% (All through 12/31/09)

As of December 31, 2009, "Kirk's Newsletter Explore Portfolio" is up 33.5% YTD vs. DJIA up 18.8% YTD


2009 Bradley Turn Dates:
January 20-21
Feburary 8-9
June 3
June 26
July 14-15
September 14-15
October 22-23
November 9
Arch Crawford uses the Bradley to write his newsletter, the Crawford Perspective. On November 9, 2008 Peter Brimelow wrote:
Over the year to date through October, Crawford Perspectives is up a breathtaking 36% by Hulbert Financial Digest count, vs. negative 32.94% for the dividend-reinvested Dow Jones Wilshire 5000.

Over the past 12 months, Crawford is up 6% vs. negative 36.3% for the total return DJ-Wilshire 5000.
People like to follow what is working. If Arch Crawford was the top, big name market timer this year and he predicts a major rally into mid 2009, then this can be a self fulfilling prophecy as followers can move the market.

Before you get too excited about Crawford's predictions, Brimelow continued:
This is not a flash in the pan ... well, not completely. Over the past five years, the Crawford letter has achieved an annualized gain of 3.1%, vs. 0.8% annualized for the total return DJ-W.

But over the entire period that the HFD has monitored Crawford, the letter has achieved only a 4.7% annualized gain, vs. 8.8% annualized for the total return DJ-W 5000.

This is because, every once in a while, Crawford's hot hand turns into a cold claw.

For example, Crawford was one the 10 worst-performing letters of 2006.
What it all means is you can get great short-term market timing performance with anything from coin flipping to astrology, but few, if any "market timing systems" can beat the markets over the long term. Most of us rely on asset allocation and careful stock selection to match or beat the markets slowly over the long haul. Bear markets such as we are in now are the price we pay to get superior long term returns. For more, make sure you read my articles:
More info about Bradley at:

Doubled Money in a Down Market!

Since 12/31/98 "Kirk's Newsletter Explore Portfolio" is UP 159% (a double plus another 59%!!) vs. the S&P500 UP a tiny 8.6% vs. NASDAQ UP a tiny 3.5% (All through 12/31/09)

As of December 31, 2009, "Kirk's Newsletter Explore Portfolio" is up 33.5% YTD vs. DJIA up 18.8% YTD


Wednesday, October 17, 2007

Bradley Turn Dates for 2008

More info at

From Bradley Turn Dates for 2007, today, 10/17/07, is supposed to be the most important turn date for 2007.

The Bradley siderograph (more information) was developed in the 1940's by Donald Bradley to forecast the stock markets. Bradley assigned numerical values to certain planetary constellations for every day, and the sum is the siderograph. It was originally intended to predict the stock markets. William Eng, a noted technical analyst, singled out the Bradley as the only 'excellent' Timing Indicator in his book, "Technical Analysis of Stocks, Options, and Futures" (source: Astrikos).

These are the eight Bradley Turn Dates for the remainder of 2007 and 2008:

  1. December 22, 2007 (A most important date)
  2. March 8 to March 9, 2008
  3. April 4, 2008
  4. April 27, 2008
  5. May 24, 2008
  6. June 6, 2008 (A most important date)
  7. September 9, 2008
  8. September 20, 2008
  9. December 14, 2008 (A most important date)

Also see: Bradley Turn Dates for 2007.

Two investment newsletters rely heavily on the Bradley Siderograph and their returns are terrible. Mark Hulberts "Hulbert Financial Digest" reports in the "Long Term Performance Ratings through June 30, 2006" the following:
  • "The Crawford Perspective" has an average annual return of only 4.9% since its 12/31/88 inception. If shorting is allowed, the returns are a negative 7.2% while a buy and hold of the Wilshire5000 over the same period yielded an average annual return of +11.5%!
  • Peter Eliades' Stockmarket Cycles has an average annual return of only 4.7% since its 12/31/84 inception while a buy and hold of the Wilshire5000 over the same period yielded an average annual return of +12.4%!

My newsletter has a much better record but I am always interested in new ideas. Click for a FREE SAMPLE issue.
Followers - Click "follow" to get an email alert for new articles

Kirk Lindstrom's Investment Letter Performance