Don't Miss Out On Great Gains! - Best Investment Newsletter


Click for FREE sample of Kirk Lindstrom's Investment Letter

Don't miss out! Subscribe Now

google.com, pub-7001134751860982, DIRECT, f08c47fec0942fa0

Search For More

Showing posts with label Russell 2000. Show all posts

Saturday, February 09, 2019

Is This a New Bull Market or Bear Market Rally?

The rally since the Christmas bear market lows has been large and fast.  
The question all want to know and that gets extensive debate on message board is: 
Is this a new bull market that will make new highs soon or are we in a bear market rally that will roll over soon and lead us to new lows?


While the major indexes are still down 6.4% to 13.5% from their 2018 record highs, they are up between 7.6% and 11.7% already this year.
All four hourly index charts above show that indexes rallied above an "inverted head and shoulder bottom pattern" then pulled back this week to test that breakout or neckline from above.  If that neckline holds and the indexes continue to rally higher, then the odds favor new highs for most of the indexes.  The green line with an arrow head on the Russell 2000 chart shows the target of the pattern is below its 2018 high while the Dow pattern has a target of a new high.

My Explore Portfolio made several record highs before pulling back slightly Friday.  It really helped to be taking profits last year when the market was at record highs then buying stocks near the Christmas Bear Market Lows.  The types of stocks in my Explore Portfolio usually lead out of bear market bottoms and now is no exception so this is also bullish.


 Subscribe NOW and get the February 2019 Issue for FREE!!!
This "Andrew's Pitchfork" chart of the S&P 500 show two possible scenarios.

  1. The red "bearish pitchfork" suggests the rally is over or nearly over while 
  2. the green "bullish pitchfork" suggests the rally is only about half way to its peak.

Only time will tell since nobody knows for sure what the markets will do in the short term.  I've taken some profits on what I bought near the lows last year so I have plenty of cash to buy if the markets test their Christmas lows or even go lower.  Also, I have plenty in the market and will just take more profits if the markets continue high.  As my results from on the record for over 20 years show, I don't need to be "right" about the short term market direction as my method works best with some volatility.

To understand more, please read these KEY articles:
Discuss this article on my "Investing for the long term" Facebook group. 

.

Wednesday, August 06, 2014

Russell 2000 Resistance Support Charts with Correction Statistics

The current correction for the Russell 2000 shows the peak decline from its recent all-time record high, so far, was 10.8%.  Currently the Russell 2000 is  7.6% below the all-time record high.


Intraday "Correction" Statistics for Russell 2000 as of 08/06/14
More Russell 2000 charts and Quote
Last Market High 07/01/14 at 1,213.55
Last Market low 08/01/14 at 1,082.53
Current R2000 Price 1,121.56
Decline in Points = 91.99
Decline in percent = 7.6%
Max Decline = 10.8%
=>This means the decline from intraday high to intraday low is 10.8% and we are currently 0.075802398 7.6% off the peak.


From ChartoftheDay.com
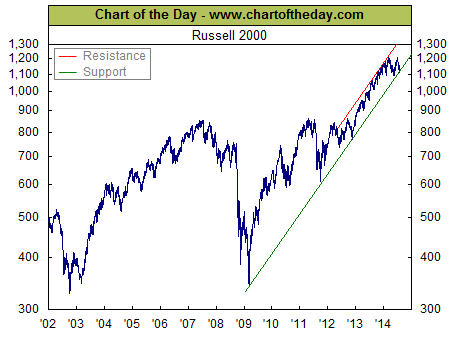
For some perspective on the current state of the stock market, today's chart presents the long-term trend of the Russell 2000 (small-cap stocks). As the chart illustrates, the Russell 2000 rallied from late 2002 into the mid-2007 and then effectively gave all of that back during the financial crisis. Since the financial crisis, the Russell 2000 has been rallying sharply to the upside (with the exception of a brief "fiscal cliff" induced selloff in November 2012). Since early March 2014, however, the Russell 2000 has moved significantly to the downside and is now testing support of its upward sloping, post-financial crisis trend channel.

My Recent FREE Seeking Alpha articles:

Followers - Click "follow" to get an email alert for new articles

Kirk Lindstrom's Investment Letter Performance