Don't Miss Out On Great Gains! - Best Investment Newsletter


Click for FREE sample of Kirk Lindstrom's Investment Letter

Don't miss out! Subscribe Now

google.com, pub-7001134751860982, DIRECT, f08c47fec0942fa0

Search For More

Showing posts with label 2CS. Show all posts

Thursday, March 05, 2020

Investor Sentiment Charts for March 5, 2020

At the end of February the Stock market, as measured by the Dow, S&P 500, the NASDAQ and the Russell 2000, was down double digits from recent record highs.  Yesterday it was up some from those lows.  

Investor sentiment was extremely bullish as the stock market was making those record highs but now it is much subdued with some readings at extremely bearish levels. 

As of 8:30 AM PST today (3/5/20) all four markets are down 1% to 10% with my Newsletter Explore Portfolio down 2.9%.

Market Update for Wednesday March 4, 2020
Market Graph for Thursday March 5, 2020:
Market Update for Friday February 28, 2020


Fear & Greed Index for Thursday March 5, 2020
Fear and Greed Index vs S&P 500:

DJIA vs Oscillators 

2CS-p

II Investors Intelligence Bulls vs Bears

AAII Survey: Bulls minus Bears vs. Log DJIA

CPC Put/Call Ratio


Kirk Lindstrom's Investment Letter
Don't miss out!


x

Saturday, November 02, 2019

Investor Sentiment Charts for November 2, 2019

The Stock market, as measured by the S&P 500 and the NASDAQ, is at a record high.  As you would expect, investor sentiment has recovered quite a bit from its recent lows with the short term "Fear and Greed Index" now in rated as "Extreme Greed."  Many of my longer-term sentiment charts remain well below excessive optimism.

Market Update for Friday Nov. 1, 2019
Fear and Greed Index
Fear and Greed Index vs S&P 500:


Investors Intelligence Bulls / (Bulls+Bears) vs S&P 500 Weekly Close

Put:Call Ratio:
DJIA vs Oscillators 

2CS-p

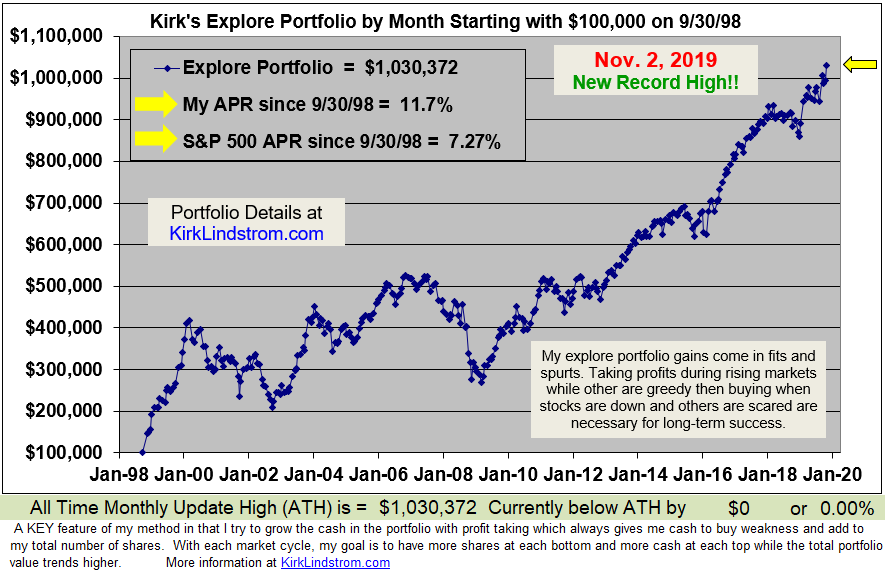
New Record High for My Explore Portfolio!   I've taken profits and now have my Explore Portfolio at WX% in Stocks and YZ% in Fixed Income.  Subscribe now to find out what I hold.


Kirk Lindstrom's Investment Letter
Don't miss out!


Saturday, December 01, 2018

Investors Intelligence Sentiment Data & 2CS vs S&P 500

Investors Intelligence Sentiment : Bulls / (Bulls+Bears) vs S&P 500 11/30/18

Sentiment is down considerably from the record highs it made early in the year when the stock market was at its peak.
 

Chart of Investors Intelligence Sentiment SurveyBulls / (Bulls+Bears) vs S&P500
Click Graphs for Full Size Images
Market Update

 Subscribe NOW  and get
the
 November 2018 
Issue for FREE!!!

The 2CS is doing nicely too after another great buy signal

My Last article: New Series I Bond Rates

More info at 
Investors' Intelligence Sentiment Indicator

Saturday, June 16, 2018

Stock Market & Sentiment Update for June 16, 2018

We're nearly half way into 2018 and all stock markets have positive returns while the bond market, as measured by Vanguard's Total Bond Fund, is down 1.99% YTD.
Click the chart to see full sized images 
Market (charts) Update

Below are many of my favorite charts.  I explain most of the sentiment charts when I feature them in my newsletter.

Click "Follow" at the bottom of this blog to get FREE email notifications from Google's Blogger when I post new updates.


To get my "Special Email Alerts" and the "Auto Buy Sell Table" where I list ahead of time what stocks I will buy at what prices during declines and what I will sell during the advances. These buys and sells are at preset target prices you can use to set limit orders at your broker.
 Subscribe NOW  and get
the
 June 2018 
Issue for FREE!!!

Thursday, February 15, 2018

2CS & CPC Charts Still Show High Fear Levels

Kirk's Stock Market & Sentiment Charts for February 15, 2018.

This market update chart shows the Dow, S&P 500, Nasdaq and Russell 2000 small cap index are now all back in the green for the year.

Click "Follow" at the bottom of this blog to get FREE email notifications from Google's Blogger when I post new updates.

This chart shows the depth of the correction for the major averages.  How many who said they would buy after a 10% correction showed up?  It looks like some sure did!
This chart shows the S&P 500 has rallied to its 50-day moving average, MA(50), after correcting down to its MA(200).
This chart shows the Dow corrected down to the dotted orange trend line before bouncing.

 These sentiment charts show that even after a big recovery, there is still plenty of fear remaining.


Can you guess when I will draw the next green dot?
Fear and Greed index starting to recover.

 This inverted head & shoulder plot is very exciting.

Did you buy anything during the market decline? 

I did.  Here is part of one of my special email alerts I sent my subscribers:


Click "Follow" at the bottom of this blog to get FREE email notifications from Google's Blogger when I post new updates.

To get my "Special Email Alerts" and the "Auto Buy Sell Table" where I list ahead of time what stocks to buy at what prices during this decline,  
 Subscribe NOW  and get
the
 February 2018 
Issue for FREE!!!
Kirk Lindstrom's Investment Letter
(My SPECIAL ALERT emails will begin as soon as I get payment via check or PayPal)

Followers - Click "follow" to get an email alert for new articles

Kirk Lindstrom's Investment Letter Performance