Don't Miss Out On Great Gains! - Best Investment Newsletter


Click for FREE sample of Kirk Lindstrom's Investment Letter

Don't miss out! Subscribe Now

google.com, pub-7001134751860982, DIRECT, f08c47fec0942fa0

Search For More

Showing posts with label GLD. Show all posts

Thursday, October 10, 2019

Investor Sentiment Charts for October 10, 2019

The markets are just off record highs yet investor sentiment is quite bearish.  This is great news for contrarian investors.

This table shows the S&P 500 is only 2.9% below its record high,  the Russell 2000 small cap index is 14.7% off its record high while the Dow and Nasdaq markets are somewhere in between these two.
Market Data for 10/10/19
Market Comparison
Market Sentiment Charts for 10/10/19:

This CPC chart is one of my favorites for aiding me buy and sell around my core positions in addition to the limit orders I have for each stock in my newsletter.  That is I will add or subtract to positions and send out "Special Alert Emails" notifying my subscribers when this CPC and some of my other sentiment charts (not all published below) say it is time.


AAII Survey: Bulls minus Bears vs. Log DJIA


Dow vs proprietary "Oscillators" that also give me help knowing when to add or subtract from my Explore Portfolio positions.


TD: Timer Digest ST (1-yr) Bulls - Bears vs. S&P 500
10/10/19 Close


Once a month in my newsletter on page 6 I update one or more of my sentiment charts and discuss in more detail what they mean to me.  Send for a free sample to see what it looks like.


Kirk Lindstrom's Investment Letter
Don't miss out!
 Subscribe NOW

and get the October 2019 Issue For Free!


Thursday, September 12, 2019

Investor Sentiment Charts for September 11, 2019

Yesterday my Newsletter Explore Portfolio and my own personal portfolio closed at record highs.  
Market Data for 9/11/19
Market Update - Closing Statistics
Despite the markets being close to record highs, investor sentiment is not as bullish as one might think.  Below are some of the sentiment charts I follow.

The "pros" in the II graph are more bullish than individual investors in the AAII graph with the number of bullish individual investors back above the number of bullish investors.


II Bulls-Bears Sentiment Graph - Log Scale

AAII Survey: Bulls minus Bears vs. Log DJIA


Kirk Lindstrom's Investment Letter
Don't miss out!
 Subscribe NOW

and get the September 2019 Issue For Free!

TD: Timer Digest ST (1-yr) Bulls - Bears vs. S&P 500  

TD: Timer Digest Gold Bulls - Bears vs. GLD 

Put Call Ratio ($CPC)

TD Timer of the Year Race
(I'm tied for second for 2019!)


Let me know if you have any other favorite charts of mine you'd like to see on a regular basis.
Kirk Lindstrom's Investment Letter
Don't miss out!
 Subscribe NOW

and get the September 2019 Issue For Free!

Never Forget 9/11/01

Tuesday, April 28, 2015

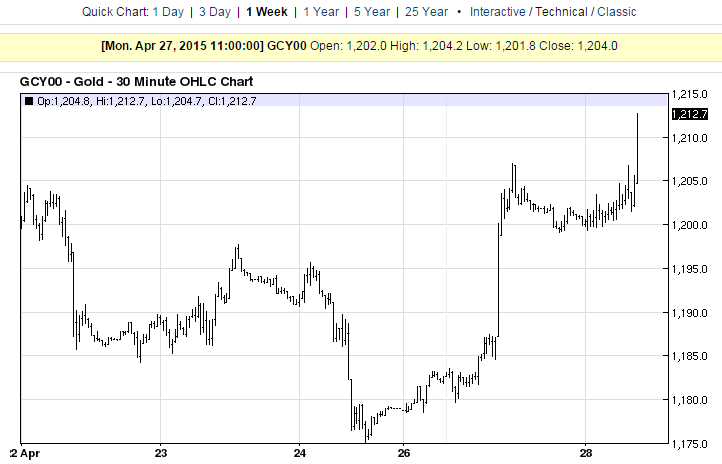
Gold Back Above $1,200 per Ounce

Yesterday gold surged above $1,200/oz. for its best day since January.
  • Reports on Friday sad Venezuela's central bank had converted 1.4M oz. of its gold reserves into at least $1B in cash through a swap with Citibank. 
  • "That was a huge potential seller taken out of the market. It's not an overhang anymore," Dennis Gartman said on the Venezuela deal.
  • Other gold watchers say the bigger factor driving prices was the expiration of May options and short covering; an increase of 13K shorts in the market is a positive since those traders could be forced to buy gold when they cover, says Kevin Grady of Phoenix Futures and Options.
Today gold futures are higher again:
Gold testing a 15-year trend line:

Gold prices retraced the 61.8% Fibonacci level 
Is the bottom in?


Are you Long, neutral or short gold?  

I have a gold trade in my newsletter.

Monday, April 21, 2014

Gold Testing Support

Gold is testing support of a falling trend line from above.


Here is a larger chart showing the active trendlines. 


Disclosure: I have a small, personal position in GLD () for an attempt to profit from a counter trend rally.  I have a mental stop loss and will not post what it is or post when I take it...  I have not added this GLD trade to my newsletter explore portfolio as I am still experimenting with this idea.  Also, I have stocks I like with what I believe is far more upside in my explore portfolio  Also, I have larger personal positions in those "explore" stocks.


Wednesday, November 27, 2013

Gold & GLD Resistance and Support Charts

Charts showing the important resistance and support levels for Gold and its exchange traded fund, GLD.  This morning I sent buy and sell levels for potential GLD trades to my subscribers.  If you would like to get this email, subscribe to my newsletter and I will send it to you.

Gold appears to be testing its 3-year low near the 61.8% Fibonacci retracement of the run from $681 to $1,923.70 per ounce.  
Click images to view full size
If the  61.8% Fibonacci support fails, then the next major support level for gold is the 2008 high of $1,033.90.
This graph shows gold prices for the last three years .  


This graph shows resistance and support levels for GLD, the exchange traded fund for Gold and my first choice as a low cost way to trade gold.
More charts and current quotes:
Don't Miss Out!
Subscribe Now

and get the November issue for free
(Start subscription with December issue)

A Gold Digger

Tuesday, March 01, 2011

Jim Cramer Recommends Gold and Gold Corp.

Update 7/29/13: Today on CNBC's "Street Signs" at about 11:30AM PST Amanda Drury interviewed Jim Cramer for their regular "stop trading" segment.  Gold (Quote and Chart) closed at $1,410.90 per ounce near its all time high.

Jim Cramer was very excited about Gold.  Cramer said
  • "I've been a gold bug since 'Mad Money" began.
  • EVERYONE should have ten to twenty percent of their portfolios in gold.
  • Gold is "extraordinarily poised to go up better than ANY OTHER ASSET in the world."
  • Gold "could see $1,550 very quickly"
  • Gold "could" see $2,000 per ounce within 18 months.
  • "They can't find the stuff."
  • EVERYONE must own gold!
  • "Gold is your antidote to what is going on.... Chaos in Washington.  Chaos in the Middle East."
Today Gold closed at $1,410.90 per ounce near its all time high.
When asked what he liked for a stock pick, Jim recommended Goldcorp (GG).  Jim said he likes GG because of their low p[roduction costs and "ability to find the stuff."

Today GG closed at $49.34, slightly below its all time high
I wonder how many people will add Gold or Goldcorp to their portfolios now near all time record highs based on Jim's advice.

Questions:
  1. Can anyone verify that Cramer has been a gold bug since his Mad Money show began?  
  2. Has Cramer had Gold in his action alerts portfolio for 10 to 20% from the start? 
  3. Was it a small position that grew with the large gain in gold? 
    Or 
  4. did he add Gold recently?
Personally, I own a very small amount of gold hidden in the house for bribes if we see Armageddon, but I own "treasury inflation protected securities" (TIPS) mutual funds (like the ETF TIP or managed funds FINPX, VIPSX) and Series I-Bonds, as well as individual TIPS. I also believe it is a good time to own equities, including SPY, the exchange traded fund for the S&P500, for both inflation protection and income.

The individual 30-yr TIPS I said I was buying in "How to Play Expected Inflation From the TIPS Spread" are up about 6% in just two weeks already. I am not making any predictions for the price of Gold, but individual TIPS bought directly from the US Treasury are safe since they won't lose money if the price of gold crashes.

More Information:

Thursday, February 10, 2011

Gold to Silver Price Ratio Near Multi-Decade Lows

The gold-to-silver price ratio, defined as the price of an ounce of gold divided by the price of an ounce of silver, closed Wednesday at 45.16 This means an ounce of gold is just over forty five times more expensive than an ounce of silver.
Charts of the gold-to-silver price ratio, GLD, SLV, Gold and Silver prices plus the rest of my Seeking Alpha article at:
Gold / Silver Price Ratio Near Multi-Decade Lows
As my chart shows, twenty years ago in 1991, gold was over 100 times more expensive than silver. Since then, the gold-to-silver price ratio never went below 41.51.

Tuesday, March 02, 2010

George Soros Says Gold is in Early Stage of Asset Bubble

George Soros believes gold is in the early phase of an asset bubble. Just as NASDAQ staock were a good buy in 1998, Mr.Soros thinks gold is a good buy now.

Make sure to read

From Soros signals gold bubble as Goldman predicts record at the Financial Post:
"When interest rates are low we have conditions for asset bubbles to develop, and they are developing at the moment," Mr. Soros said at the World Economic Forum's annual meeting in Davos, Switzerland, in January. "The ultimate asset bubble is gold," he said.

In a Jan. 28 Bloomberg Television interview, the 79-year-old billionaire recalled that former Federal Reserve Chairman Alan Greenspan warned of "irrational exuberance" in financial markets three years before the technology bubble burst in 2000. The Standard & Poor's 500 Index rose 89% in the period.

Buying at the start of a bubble is "rational," Mr. Soros said.
According to a Feb. 16 Securities and Exchange Commission filing, the $25 billion "Soros Fund Management LLC" increased its investment in the SPDR Gold Trust GLD (Quote and charts) by 152% in the fourth quarter. GLD is the world's largest exchange-traded fund for gold.

Click for full size image courtesy of stockcharts.com

See recent articles:
Chart of Gold vs GLD

Quotes and Charts for
Gold and GLD


Thursday, December 10, 2009

Jim Rogers On Dollar, Gold, Stocks, Sterling and More

Jim Rogers was a guest on CNBC's Closing Bell with Maria Bartiromo today.

On the Dollar, Rogers said:
  • the Federal Reserve has run out of bullets and we don't have enough trees to print any more money.
  • the dollar will probably have a short-term rally just because everyone is so bearish on it now.
On gold (Gold charts and GLD charts), Rogers said:
  • Gold will reach $2,000 per ounce by 2019, about 6% a year gain.
  • Gold's recent surge (to $1,351.50 Current Gold Quote) is due to large budget deficits
  • Gold will power the great commodities run that he thinks will last for the next decade.
General comments by Jim Rogers.

Rogers has correctly been bullish on commodities over stocks for the past decade.

Rogers would rather own agriculture, silver or palladium over gold or copper since silver is still 70% below its all-time high.

Become a farmer. Learn to drive a tractor. We have a shortage of farmers.

Water is a spectacular opportunity.

He is skeptical of the economy going forward and the US market is up 70% so he'd not put money into US stocks. If the economy recovers, he feels his commodities will go up anyway.

He is not buying any stocks because they are all going up but he still owns some stocks in China.

"China churns out 15 or 20 times as many engineers as we do, every year." What Jim fails to mention is many of those "engineers" might be auto mechanics and other technicians here because they are not all design engineers. Still, even twice as many design engineers is a big deal and I think the rate is much higher.

What to avoid according to Rogers:

Jim says to avoid US Long-term US Treasury Bonds. He sees it as the next bubble since "everyone" is buying US government bonds. (except for me. I sold ALL my bonds and bond funds that are not indexed to inflation in my personal accounts and the portfolios I cover in "Kirk Lindstrom's Investment Letter.")

Jim sold all his British Sterling after holding it for 30 years. Jim said "it grieves me to see what is happening in the UK."

As of December 10, 2009, "Kirk's Newsletter Explore Portfolio" is up 32.4% YTD vs. DJIA up 18.7% YTD
(More info - Free Sample Issue)

Subscribe NOW and get the December 2009 Issue for FREE! !
(Your 1 year, 12 issue subscription will start with next month's issue.)

Past Jim Rogers articles of note:
  • April 2009: Rally will fail.
    Jimmy Rogers comments on the bailout of Wall Street and his belief that we made a bottom but it is not the final bottom.

  • March 2009: Jim Rogers Bearish, Likes Land on Larry Kudlow's "The Kudlow Report"
    "I don't think the bottom is here, maybe 'a' bottom, but not 'the' bottom. The economy is going to get worse. You can't have a good stock market without a good economy."

  • November 2008: Jim Rogers Covers Shorts
    When asked where to invest, Rogers said China. He admitted he did not take any profits in China before the crash but thinks investing in China now is like investing in the US 100 years ago.

Followers - Click "follow" to get an email alert for new articles

Kirk Lindstrom's Investment Letter Performance