Don't Miss Out On Great Gains! - Best Investment Newsletter


Click for FREE sample of Kirk Lindstrom's Investment Letter

Don't miss out! Subscribe Now

google.com, pub-7001134751860982, DIRECT, f08c47fec0942fa0

Search For More

Showing posts with label GOOG. Show all posts

Thursday, April 12, 2018

Google Village Proposed San Jose Development Map

Yesterday's San Jose Mercury News had a great article "Google’s village gets closer to reality" that discusses Google (GOOGL & GOOG) parent company Alphabet's progress on plans to build a new campus "village" near the Diridon Station transit hub. 
Mountain View-based Google and its development ally Trammell Crow have spent at least $221.6 million buying an array of properties on the western edges of downtown San Jose, within and near a 1-mile stretch that begins north of the SAP Center and reaches south nearly to Interstate 280. Among the major recent deals: The Google and Trammell Crow venture bought a large site that now is occupied by Orchard Supply Hardware, and the search giant has struck a deal to purchase a huge property from Trammell Crow that is approved for 1 million square feet, hundreds of residences and retail. Despite the extensive work and investments that have occurred already, construction isn’t going to begin tomorrow, Google executives cautioned.
Here is a map from the article
Given what has happened to property near Facebook, Tesla, Apple and Google campuses with near gridlock traffic making location close to the campuses extremely valuable, I expect San Jose real estate withing a mile of two of this development to see similar gains.  Older, established neighborhoods with large lots to build "McMansions" should do especially well if they follow what we've seen in Menlo Park (Facebook), Palo Alto (Tesla & HP), Mountain View (Google), Cupertino (Apple) and Los Altos close enough to ride a bike or a short drive to them all.  Actually, a bike ride from Menlo Park to Apple's new campus in Cupertino would be a great daily ride for exercise on Foothill Expressway.

Here is a larger Google Map of the area
Let's just hope that Google's plans are not the mark of a stock price top similar to what we saw in 2000 when Cisco (CSCO) made big plans to expand in the Coyote Valley and ended up with empty buildings near its current headquarters. 
More GOOGL charts
Kirk Lindstrom's Investment Letter
 Subscribe NOW and get the April 2018 Issue for FREE!!!
(Your 1 year, 12 issue subscription with SPECIAL ALERT emails will start with November issue.


Tuesday, December 01, 2015

Santa Clause Rally!

Below are several charts showing the "Santa Clause Rally" that seems to be gaining steam. 

After buying the big decline a few months back, some stocks are already very, very close to taking profits already!


Santa Clause Rally! $SPY $SPX $LRCX $MSFT $GOOGL $INTC ChartsI sure hope nobody is missing out on all the fun as we are creeping back towards record highs again. Here comes Santa.....
Posted by Kirk Lindstrom's Investment Letter on Tuesday, December 1, 2015

This is my buy alert for LRCX on the most recent decline below $65.

Friday, December 13, 2013

Will Google Build Server Chips & Threaten Intel's Profitable Business?

Today for smart, young adults just out of school Google (GOOGis a great place to work much like HP (HPQ) was 35 years ago when I was hired. Back then, I went to HP to design semiconductors for the Optoelectronic group (OED). HP used its own chips in many of its own products. The group I went to invented the LED for their first calculators  released when I was in high school and the 1977 HP01 watch, released when I was at UC Berkeley studying electrical engineering and computer science.  
These advance products were part of what inspired me to study semiconductor engineering. 
(I get a kick out of how Apple(AAPL), Google and Samsung are still talking about getting regular folks to dress like geeks with wearable computing technology invented by HP and released as a product in 1977!) 

OED grew and spun off OCD (Optical Communication Division) where I designed fiber optic transceivers and later infrared (IrDA) transceivers when Bluetooth and WiFi were still too expensive so the industry used light to communicate wirelessly between devices.
Later chips went into HP computers and later PCs. Eventually, it was not cost effective so we sold the unit (mostly R&D) to Intel. One of my friends and neighbors still works at Intel designing advanced processes. I speculated that this was "cyclical" and eventually some companies would want more control of the chips and not rely on Intel or TSMC and bring both design and manufacturing back in house.

From Wall Street Breakfast at Seeking Alpha:

Intel threatened as Google mulls creating own server chips. Google ( GOOG) is reportedly thinking about designing its own server processors using technology from ARM Holdings ( ARMH). The idea is that with its own chips, Google could better manage the interaction between hardware and software. The move could hurt Intel ( INTC), which earns over 4% of its revenue from the search giant, and which has a 95% share of the market for server chips that use PC processors.
It is interesting that Google is now so big that they are contemplating doing their own chips. Will they also build their own fabs or have UMC, TSMC, Samsung or even Intel build the chips for them?


Kirk Lindstrom's Investment Letter
Don't Miss Out!
Subscribe Now

Get December Issue for Free!
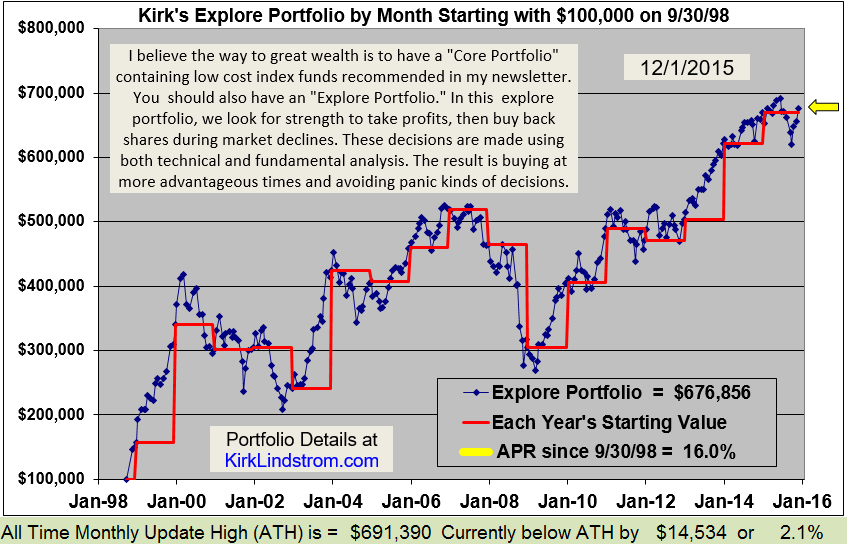
==>   My returns by year  &  New Record Highs <==
This table shows my newsletter "Core and Explore Portfolios" from 1998 through the end of Q3


Thursday, October 14, 2010

Google Q3-2010 Earnings Announcement Press Release

MOUNTAIN VIEW, Calif. – October 14, 2010 - Google Inc. (NASDAQ: GOOG) today announced financial results for the quarter ended September 30, 2010.
"Google had an excellent quarter," said Eric Schmidt, CEO of Google. "Our core business grew very well, and our newer businesses -- particularly display and mobile -- continued to show significant momentum. Going forward, we remain committed to aggressive investment in both our people and our products as we pursue an innovation agenda."

Q3 Financial Summary

Google reported revenues of $7.29 billion for the quarter ended September 30, 2010, an increase of 23% compared to the third quarter of 2009. Google reports its revenues, consistent with GAAP, on a gross basis without deducting traffic acquisition costs (TAC). In the third quarter of 2010, TAC totaled $1.81 billion, or 26% of advertising revenues.
Google reports operating income, operating margin, net income, and earnings per share (EPS) on a GAAP and non-GAAP basis. The non-GAAP measures, as well as free cash flow, an alternative non-GAAP measure of liquidity, are described below and are reconciled to the corresponding GAAP measures in the accompanying financial tables.
  • GAAP operating income in the third quarter of 2010 was $2.55 billion, or 35% of revenues. This compares to GAAP operating income of $2.07 billion, or 35% of revenues, in the third quarter of 2009. Non-GAAP operating income in the third quarter of 2010 was $2.93 billion, or 40% of revenues. This compares to non-GAAP operating income of $2.39 billion, or 40% of revenues, in the third quarter of 2009.
  • GAAP net income in the third quarter of 2010 was $2.17 billion, compared to $1.64 billion in the third quarter of 2009. Non-GAAP net income in the third quarter of 2010 was $2.46 billion, compared to $1.88 billion in the third quarter of 2009.
  • GAAP EPS in the third quarter of 2010 was $6.72 on 322 million diluted shares outstanding, compared to $5.13 in the third quarter of 2009 on 320 million diluted shares outstanding. Non-GAAP EPS in the third quarter of 2010 was $7.64, compared to $5.89 in the third quarter of 2009.
  • Non-GAAP operating income and non-GAAP operating margin exclude the expenses related to stock-based compensation (SBC). Non-GAAP net income and non-GAAP EPS exclude the expenses related to SBC and the related tax benefits. In the third quarter of 2010, the charge related to SBC was $380 million, compared to $318 million in the third quarter of 2009. The tax benefit related to SBC was $85 million in the third quarter of 2010 and $73 million in the third quarter of 2009.

Q3 Financial Highlights

Revenues – Google reported revenues of $7.29 billion in the third quarter of 2010, representing a 23% increase over third quarter 2009 revenues of $5.94 billion. Google reports its revenues, consistent with GAAP, on a gross basis without deducting TAC.
Google Sites Revenues - Google-owned sites generated revenues of $4.83 billion, or 67% of total revenues, in the third quarter of 2010. This represents a 22% increase over third quarter 2009 revenues of $3.96 billion.
Google Network Revenues - Google’s partner sites generated revenues, through AdSense programs, of $2.20 billion, or 30% of total revenues, in the third quarter of 2010. This represents a 22% increase from third quarter 2009 network revenues of $1.80 billion.
International Revenues - Revenues from outside of the United States totaled $3.77 billion, representing 52% of total revenues in the third quarter of 2010, compared to 52% in the second quarter of 2010 and 53% in the third quarter of 2009. Excluding gains related to our foreign exchange risk management program, had foreign exchange rates remained constant from the second quarter of 2010 through the third quarter of 2010, our revenues in the third quarter of 2010 would have been $9 million lower. Excluding gains related to our foreign exchange risk management program, had foreign exchange rates remained constant from the third quarter of 2009 through the third quarter of 2010, our revenues in the third quarter of 2010 would have been $169 million higher.
  • Revenues from the United Kingdom totaled $840 million, representing 12% of revenues in the third quarter of 2010, compared to 13% in the third quarter of 2009.
  • In the third quarter of 2010, we recognized a benefit of $89 million to revenues through our foreign exchange risk management program, compared to $39 million in the third quarter of 2009.
Paid Clicks – Aggregate paid clicks, which include clicks related to ads served on Google sites and the sites of our AdSense partners, increased approximately 16% over the third quarter of 2009 and increased approximately 4% over the second quarter of 2010.
Cost-Per-Click – Average cost-per-click, which includes clicks related to ads served on Google sites and the sites of our AdSense partners, increased approximately 3% over the third quarter of 2009 and increased approximately 2% over the second quarter of 2010.
TAC - Traffic Acquisition Costs, the portion of revenues shared with Google’s partners, increased to $1.81 billion in the third quarter of 2010, compared to TAC of $1.56 billion in the third quarter of 2009. TAC as a percentage of advertising revenues was 26% in the third quarter of 2010, compared to 27% in the third quarter of 2009.
The majority of TAC is related to amounts ultimately paid to our AdSense partners, which totaled $1.52 billion in the third quarter of 2010. TAC also includes amounts ultimately paid to certain distribution partners and others who direct traffic to our website, which totaled $285 million in the third quarter of 2010.
Other Cost of Revenues - Other cost of revenues, which is comprised primarily of data center operational expenses, amortization of intangible assets, content acquisition costs as well as credit card processing charges, increased to $747 million, or 10% of revenues, in the third quarter of 2010, compared to $667 million, or 11% of revenues, in the third quarter of 2009.
Operating Expenses - Operating expenses, other than cost of revenues, were $2.19 billion in the third quarter of 2010, or 30% of revenues, compared to $1.64 billion in the third quarter of 2009, or 28% of revenues.
Stock-Based Compensation (SBC) – In the third quarter of 2010, the total charge related to SBC was $380 million, compared to $318 million in the third quarter of 2009.
We currently estimate SBC charges for grants to employees prior to October 1, 2010 to be approximately $1.4 billion for 2010. This estimate does not include expenses to be recognized related to employee stock awards that are granted after September 30, 2010 or non-employee stock awards that have been or may be granted.
Operating Income - GAAP operating income in the third quarter of 2010 was $2.55 billion, or 35% of revenues. This compares to GAAP operating income of $2.07 billion, or 35% of revenues, in the third quarter of 2009. Non-GAAP operating income in the third quarter of 2010 was $2.93 billion, or 40% of revenues. This compares to non-GAAP operating income of $2.39 billion, or 40% of revenues, in the third quarter of 2009.
Interest and Other Income (Expense), Net – Interest and other income (expense), net increased to an income of $167 million in the third quarter of 2010, compared to an expense of $7 million in the third quarter of 2009.
Income Taxes – Our effective tax rate was 20% for the third quarter of 2010.
Net Income – GAAP net income in the third quarter of 2010 was $2.17 billion, compared to $1.64 billion in the third quarter of 2009. Non-GAAP net income was $2.46 billion in the third quarter of 2010, compared to $1.88 billion in the third quarter of 2009. GAAP EPS in the third quarter of 2010 was $6.72 on 322 million diluted shares outstanding, compared to $5.13 in the third quarter of 2009 on 320 million diluted shares outstanding. Non-GAAP EPS in the third quarter of 2010 was $7.64, compared to $5.89 in the third quarter of 2009.
Cash Flow and Capital Expenditures – Net cash provided by operating activities in the third quarter of 2010 totaled $2.89 billion, compared to $2.73 billion in the third quarter of 2009. In the third quarter of 2010, capital expenditures were $757 million, the majority of which was related to IT infrastructure investments, including data centers, servers, and networking equipment. Free cash flow, an alternative non-GAAP measure of liquidity, is defined as net cash provided by operating activities less capital expenditures. In the third quarter of 2010, free cash flow was $2.13 billion.
We expect to continue to make significant capital expenditures.
A reconciliation of free cash flow to net cash provided by operating activities, the GAAP measure of liquidity, is included at the end of this release.
Cash – As of September 30, 2010, cash, cash equivalents, and marketable securities were $33.4 billion.
Headcount – On a worldwide basis, Google employed 23,331 full-time employees as of September 30, 2010, up from 21,805 full-time employees as of June 30, 2010. 

WEBCAST AND CONFERENCE CALL INFORMATION

A live audio webcast of Google’s third quarter 2010 earnings release call will be available at http://investor.google.com/webcast.html. The call begins today at 1:30 PM (PT) / 4:30 PM (ET). This press release, the financial tables, as well as other supplemental information including the reconciliations of certain non-GAAP measures to their nearest comparable GAAP measures, are also available on that site. 

Key Statistics:
  • After hours Price as I type = $590
  • Shares Outstanding = 318.71M
  • Market Cap at $590 = $188B
  • Cash per share = $33.4 billion / 318.71M = $105
Disclosure:  Long Google in my personal account and  in the "Explore Portfolio" in  "Kirk Lindstrom's Investment Letter" at a $310 entry price. 

Thursday, July 30, 2009

Microsoft and Yahoo! Agree to Terms for New Search Agreement

Terms of Search Agreement Between Microsoft and Yahoo!

Yesterday Microsoft (MSFT Charts) and Yahoo! (YHOO) announced they reached an agreement for search advertising collaboration. Note that "search" includes Microsoft's AdCenter which is similar to Google's AdSense that I have on this blog and my web pages where I am compensated by Google when people click ads.

For this collaboration to be successful, Microsoft and Yahoo! will need to offer pay-per-click rates high enough to get content providers from The Wall Street Journal to bloggers like me to choose or switch to their platform. The only way they can do that is to increase scale to reduce overhead so they can pay a higher percentage per click.

Microsoft will now power Yahoo! search while YHOO will become the exclusive worldwide relationship sales force for both companies' premium search advertisers.

The key terms of the agreement are as follows:
• The term of the agreement is 10 years;
• Microsoft will acquire an exclusive 10 year license to Yahoo!’s core search technologies, and Microsoft will have the ability to integrate Yahoo! search technologies into its existing web search platforms;
• Microsoft’s Bing will be the exclusive algorithmic search and paid search platform for Yahoo! sites. Yahoo! will continue to use its technology and data in other areas of its business such as enhancing display advertising technology.
• Yahoo! will become the exclusive worldwide relationship sales force for both companies’ premium search advertisers. Self-serve advertising for both companies will be fulfilled by Microsoft’s AdCenter platform, and prices for all search ads will continue to be set by AdCenter’s automated auction process.
• Each company will maintain its own separate display advertising business and sales force.
• Yahoo! will innovate and “own” the user experience on Yahoo! properties, including the user experience for search, even though it will be powered by Microsoft technology.
• Microsoft will compensate Yahoo! through a revenue sharing agreement on traffic generated on Yahoo!’s network of both owned and operated (O&O) and affiliate sites.
• Microsoft will pay traffic acquisition costs (TAC) to Yahoo! at an initial rate of 88% of search revenue generated on Yahoo!’s O&O sites during the first 5 years of the agreement.
• Yahoo! will continue to syndicate its existing search affiliate partnerships.
• Microsoft will guarantee Yahoo!’s O&O revenue per search (RPS) in each country for the first 18 months following initial implementation in that country.
• At full implementation (expected to occur within 24 months following regulatory approval), Yahoo! estimates, based on current levels of revenue and current operating expenses, that this agreement will provide a benefit to annual GAAP operating income of approximately $500 million and capital expenditure savings of approximately $200 million. Yahoo! also estimates that this agreement will provide a benefit to annual operating cash flow of approximately $275 million.
• The agreement protects consumer privacy by limiting the data shared between the companies to the minimum necessary to operate and improve the combined search platform, and restricts the use of search data shared between the companies. The agreement maintains the industry-leading privacy practices that each company follows today.
In the Microsoft Press Release Microsoft Chief Executive Officer Steve Ballmer said the agreement will provide Microsoft’s search engine, Bing, the scale necessary to more effectively compete, attracting more users and advertisers, which in turn will lead to more relevant ads and search results.

The agreement does not cover each company’s web properties and products, email, instant messaging, display advertising, or any other aspect of the companies’ businesses. In those areas, the companies will continue to compete vigorously.

The companies have established a website at http://www.choicevalueinnovation.com to provide consumers, advertisers and publishers with additional information about the benefits of the agreement.

Disclaimer: I own GOOG and MSFT in my personal portfolio. I also cover GOOG and MSFT in "Kirk Lindstrom's Investment Letter." I may buy or sell all or some at any time without public announcement beforehand.

Tuesday, May 12, 2009

Embed Google Finance charts in Blogs - Feature Request

Dear Google Finance

I want to embed Google (GOOG Charts) Finance charts in my blog posts like I can do now with Yahoo! and Wikiinvest as shown below and at the end of this blog post.

I own Google stock in my personal and newsletter portfolios. Thus, I would prefer to promote Google rather than the other two companies that have nice features to embed charts in blogs but I have no vested interest in using their charts to send them traffic via click throughs.

You already have the feature available for YouTube (example Erin Burnett Videos) so why not add the embed feature to your stock charts?
======================================================

====================================================

For commentary and my current outlook for Google, read "Kirk's Investment Newsletter"

Sunday, April 19, 2009

How Much Did Google Pay For YouTube Video and When?

In November 2006, Google (GOOG Charts) bought privately held YouTube for $1.65 billion in stock. (Details below the charts of Google stock).

Word is out that Google will retire "AdSense video units" at the end of April because
"we've found that it hasn't been performing as well as we had hoped, so we've decided to focus our efforts on other opportunities to help publishers monetize their sites"

For commentary and my current outlook for GOOG, read "Kirk's Investment Newsletter"


From Google Closes Acquisition of YouTube

MOUNTAIN VIEW, Calif., November 13, 2006 – Google Inc. (NASDAQ: GOOG) announced today that it has closed its acquisition of YouTube, the consumer media company for people to watch and share original videos. In connection with the acquisition Google issued an aggregate of 3,217,560 shares, and restricted stock units, options and a warrant exercisable for or convertible into an aggregate of 442,210 shares, of Google's Class A common stock. The number of shares of Class A common stock issued and issuable by Google was calculated by dividing $1.65 billion less certain amounts (approximately $15 million) funded to YouTube by Google between signing and closing by the average closing price for the 30 trading days ending on November 9, 2006. 12.5% of the equity issued and issuable in the transaction will be subject to escrow for one year to secure certain indemnification obligations.
Disclaimer: I bought Google stock for the first time at $310 per share for my own personal account and "Kirk Lindstrom's Newsletter Explore Portfolio." See this pdf for an example of a recent newsletter buy alert for GE. I may sell or take profits in these shares at any time and will probably only announce it to my newsletter subscribers.

Update 3/1/2017:  Google's Stock split 2-for-1 since this article so my $310 purchase price is $155 after adjusting for the stock split.  Here is an updated chart


Kirk Lindstrom's Investment Letter:
Subscribe NOW & get the February 2017 Issue for FREE!!!

Followers - Click "follow" to get an email alert for new articles

Kirk Lindstrom's Investment Letter Performance