Don't Miss Out On Great Gains! - Best Investment Newsletter


Click for FREE sample of Kirk Lindstrom's Investment Letter

Don't miss out! Subscribe Now

google.com, pub-7001134751860982, DIRECT, f08c47fec0942fa0

Search For More

Showing posts with label SPY. Show all posts

Friday, March 03, 2023

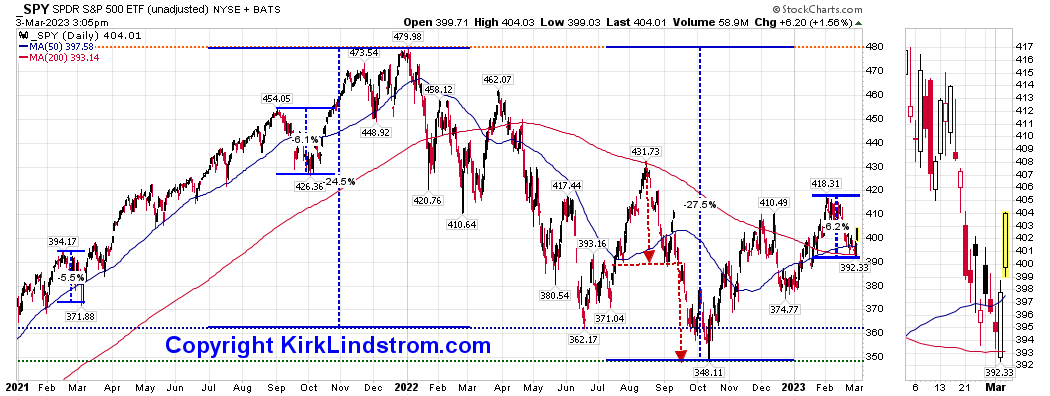
SPY Declines by Year Since 2007

 SPY (Live SPY chartsBear Markets and Intraday Corrections since 2007 Market Peak

This current decline, if over, just slightly exceeded the biggest decline in 2021!


After the 2007 to 2009 bear market, I started tracking SPY for my newsletter so I can quickly see returns with and without reinvested dividends using charting services that show returns with and without reinvested dividends.


Kirk Lindstrom's Investment Letter
To see what stocks and ETFs are in my "Explore Portfolio" and get a full list of on my price targets to both take profits or buy more:
 Subscribe NOW  and get
the
 February 2023 
Issue for FREE!!
(If you mention this ad)
Reminder, you can subscribe to this feed for free to get sent emails by Google when I post new charts and articles. Just click "Follow" below.

Thursday, December 14, 2017

FIFO Rule Removed from GOP Tax Plan Says Larry Kudlow

This is really great news for us small investors if it makes it through to the final legislation.

This photo of my TV screen tuned to CNBC this morning highlights the provisions of the GOP tax plan that both the Senate and the House of Representatives are getting close to an agreement on.

The GOP plan wanted to raise money to offset lowering taxes on the wealthy by forcing small investors like me to sell our oldest shares first  when taking profits.    Even if you just bought the SPY exchange traded index fund and reinvested dividends and wanted to take some profits, then the rule would have forced you to into a backdoor higher capital gain tax by forcing you to sell the old shares at much lower prices before you could sell the new shares reinvested near the market top!

Last week, as part of "rebalancing" and "taking profits," I sold all my reinvested SPY dividends in a taxable account just in case this rule passes.  This made a big tax hit so this week I've sold shares in some stocks that are down to offset SOME of these gains.  

If you sold stock using the GOP's proposed FIFO (First In First Out) rule, then it would be insane to reinvest dividends in taxable accounts.  That would have been bad for the markets as many might spend the money rather than reinvest.

Why it matters:

Let's say you bought Intel (INTC) 20 years ago and reinvested dividends.  Under current rules, investors can "take profits" by selling the higher priced reinvested dividend shares before they have to sell the much cheaper original shares.

Although I am not looking forward to other states subsidizing most of the high taxes I pay in California with the new GOP tax plan, I am happy to learn that for now the FIFO rule is out.

Kirk Lindstrom's Investment Letter
 Subscribe NOW and get the December 2017 Issue for FREE!!!
(My SPECIAL ALERT emails will begin immediately plus access to all past issues while your 1 year, 12 issue subscription will start with the December issue.



Saturday, August 12, 2017

Graph: US Treasury Rates & SPY Yield

US Treasury bonds still have very low yields on an historical basis.  This chart shows US Treasury rates and the Federal Reserve's Fed Fund's Rate back to 1993.

Currently, the 10-year US Treasury bond has a 2.19% yield.


For comparison, the ETF for the S&P500, SPY, has a yield of 1.94%.

This week I used some of my profit taking from soaring technology and momentum stocks near their record highs to buy a stock that was well off it's record high with a dividend yield of nearly 4%.    

Kirk Lindstrom's Investment Letter Service:
  • Subscribe to my newsletter service NOW and get the August 2017 Issue for FREE!   Your 1 year, 12 issue subscription will start with next month's issue.
  • Get email alerts when I buy or sell securities for my explore portfolio
  • "Auto Buy" and "Auto Sell" levels set ahead of time for target buy and sell levels for my securities.  This allows you to place "limit orders" with your broker in advance so you can go about your business.
  • All questions about what I write answered by Email.  If what I write is not clear to you, just ask! 


Friday, December 30, 2016

US Stock Market Summary for 2016

Market Update -  The US stock markets all made record highs this month and closed the year less than three percent below those record highs.  This table summarizes the data:
Click images to see full size

This graph shows the market data graphically for 2016 through 12/30/16.
Note the table above shows:
  • The S&P500 is 22.40% from its February 11th closing low, the day I wrote this free article "With SPY Down 14% Again, Sentiment Charts Suggest Another Tradable Low"
  • The Russell 2000 (small cap index) is up 42.30% since the February 11th low.
  • I didn't just write about this being a great time to buy, I sent out special alert emails to my newsletter subscribers while the market was bottoming in January and February as this summary of my email headers shows:
  • Feel free to verify with my subscribers who post on my Kirk Lindstrom's Investment Letter Facebook Page.
 This graph shows the S&P500 ETF SPY and its dividend back to 1992.

This graph puts the Dow Jones Industrial Average into perspective using a log chart.  Many pundits on TV say lowering the corporate tax rate will allow hundreds of billions of dollars to return to the US where some will be used for share buybacks.  This buying by companies plus scared bond investors looking for return, could easily drive the Dow back to the center blue line... of course a bear market could also drive it to the lower blue line first so I take profits at new highs to have funds to buy the declines and thus beat the market over time like very few others have.

Kirk Lindstrom's Investment Letter:
Subscribe NOW & get the December 2016 Issue for FREE!!! 

Congratulations to everyone who is in the stock market this year!
Happy New Year!

Wednesday, April 20, 2016

SPY New Record Highs - Closing & Intraday

Today SPY made new record highs for both closing and intraday values. 

SPY is a mutual fund I've recommend in my free articles at Seeking Alpha, in my newsletter's "Explore Portfolio" and the largest fund in both my newsletter's core portfolios. 

Congratulations to everyone who owns this fund and reinvests dividends as everyone is a winner when it closes above its prior intraday high.

Note the old records were 209.74 and 209.16 for intraday and closing highs, respectively.


I cover SPY in more detail my newsletter:
Kirk Lindstrom's Investment Letter
Subscribe NOW 
and
get the
 
April 2016 Issue for FREE!


Friday, December 04, 2015

SPX and SPY Just 2% Below Record Highs - Market Update

With today's big rally in the stock markets, the S&P500 is only 1.8% below its record closing high.
This is quite a recovery from just a few months ago when the markets were down double digits and I was buying shares for my newsletter portfolio. (see 
Here is a buy alert to my subscribers for Lam Research (LRCX) when it tested its August Lows a month later in September.

Fast forward to today.  Note how these charts below show buyers have shown up below the 200-day moving average, MA(200) when the price is just above the 50-day moving average, MA(50).   


Many consider it a very bullish "Golden Cross" when the MA(50) crosses above the slower moving MA(200).  At the rate the market is moving higher, this could happen soon and I'll be taking more profits.  If we fall, I still have some stocks with "Automatic Buy Levels" listed in the December newsletter that I'd be very happy to buy more of on weakness that hits my targets.

Learn my "Core and Explore" approach to investing
with "Kirk Lindstrom's Investment Letter"
Don't miss out! Subscribe Now
I have a very generous Refund Policy 

Tuesday, December 01, 2015

Santa Clause Rally!

Below are several charts showing the "Santa Clause Rally" that seems to be gaining steam. 

After buying the big decline a few months back, some stocks are already very, very close to taking profits already!


Santa Clause Rally! $SPY $SPX $LRCX $MSFT $GOOGL $INTC ChartsI sure hope nobody is missing out on all the fun as we are creeping back towards record highs again. Here comes Santa.....
Posted by Kirk Lindstrom's Investment Letter on Tuesday, December 1, 2015

This is my buy alert for LRCX on the most recent decline below $65.

Monday, August 25, 2014

SPY Breaks 200 - S&P500 breaks 2,000

Today for the first time ever, the S&P500 traded above 2,000.  SPY, the exchange traded fund (ETF) for the S&P500 also traded above 200 for the first time ever.
While the S&P500 index fund has been the largest individual mutual fund holding in my core portfolios since I started recommending them, I first recommended SPY in free articles at Seeking Alpha in early 2011.

Feb 13, 2011 How to Play Expected Inflation From the TIPS Spread
Personally, I own a very small amount of gold hidden in the house for bribes if we see Armageddon but I own "treasury inflation protected securities" (TIPS) mutual funds (like the ETF TIP or managed funds FINPX, VIPSX) and Series I-Bonds as well as individual TIPS. I also believe it is a good time to own equities including SPY, the exchange traded fund for the S&P500, for both inflation protection and income. 
Feb 7 Dow-Gold Ratio Now at Strong Resistance, Will It Break Higher or Lower?
I also believe it is a good time to own equities including SPY, the exchange traded fund for the S&P500, for both inflation protection and income.
Congratulations to all who are long the stock market!


Monday, July 15, 2013

ECRI WLI Growth near 2.3 Yr High & SPY Sets A Record High

This morning I posted a new article at Seeking Alpha titled:

S&P500 & SPY At New Record Highs While ECRI's WLI Near Multi-Year High

In that article I pointed out the current records for the S&P500 and SPY:
"On Friday July 12, 2013 the S&P500 closed at a new, all-time closing high of 1680.19. The S&P500 made its all-time intraday high on May 22, 2013 at 1,687.18."
AND
"This chart shows SPY currently is only 0.06 below its all-time intraday high."
Since posting that article, SPY has made a record, new all-time intraday high shown in this graph.
Click to view full size images here on the blog
  • Subscribe to my Newsletter service NOW and get the July 2013 Issue for FREE!  
    Your 1 year, 12 issue subscription will start with next month's issue.
  • Get email alerts when I buy or sell securities for my explore portfolio
  • "Auto Buy" and "Auto Sell" levels set ahead of time for target buy and sell levels for my securities.  This allows you to place "limit orders" with your broker in advance so you can go about your business.
  • All questions about what I write answered by Email.  If what I write is not clear to you, just ask!
  • Only $155 per year via PayPal & $150 if you send a check.

More  S&P500 Charts

More 
SPY Charts


Friday, February 25, 2011

ECRI's WLI at 42 Week High: 'Get While the Getting Is Good'

The Economic Cycle Research Institute, ECRI - a New York-based independent forecasting group, released its latest readings for its proprietary Weekly Leading Index (WLI) this morning.   (More about ECRI)

You can read my full article at Seeking Alpha:
ECRI's WLI at 42 Week High: 'Get While the Getting Is Good'
How to play ECRI's Signals: I own a lot of small cap stocks in my personal "explore portfolio" so I own SPY (SPY description and charts) to get a more market weighting in this trading portfolio. If I wanted to recommend just one ETF to be long the market and take advantage of ECRI's outlook for an upturn in the business cycle, it would be the Total Stock Market Index VTI (VTI description and charts), which has BOTH large and small cap stocks. I also own the total stock market index fund at Vanguard, (VTSMX) as part of my personal core portfolios. Vanguard discourages trading its index funds so VTI is the vehicle of choice for that.


KEY ECRI Articles:
Lakshman Achuthan - Beating the Business Cycle

“This easy-to-read book tells you how the respected ECRI calls turning points, and how you can, too.”
—Jane Bryant Quinn, Newsweek columnist

" The Economic Cycle Research Institute can justify a certain smugness now that business cycles are back in fashion."
--Harvard Business Review

“Shows... how far the state of the art in cycle forecasting has advanced, and how investors can profit from it.”
—Jon Markman, award-winning CNBC/MSN financial columnist 


Friday, July 17, 2009

New Support Levels for the S&P500 are Holding

I show two support Levels for the S&P500 on the graph below.

Click chart courtesy of stockcharts.com for full size image

#1 200-day-moving-average MA(200) was solid resistance not penetrated since May 2008. Now it is support that has been tested several times from above before the last rally.

#2 The dashed green line on the chart is the neckline of an inverted head and shoulders bottom pattern. One shoulder is "somewhat hidden" as only some components of the S&P500 were weak while others were quite strong. The pattern broke out in May and has successfully tested the neckline from above. All we need now is a rally with volume to feel very bullish.

If you have trouble seeing the inverted head and shoulder's bottom, perhaps this chart of FedEx (more FDX Charts) will make it easier.


Disclaimer: I currently personally own and I cover FDX and SPY in "Kirk Lindstrom's Investment Letter" where I currently have both in my explore portfolio.

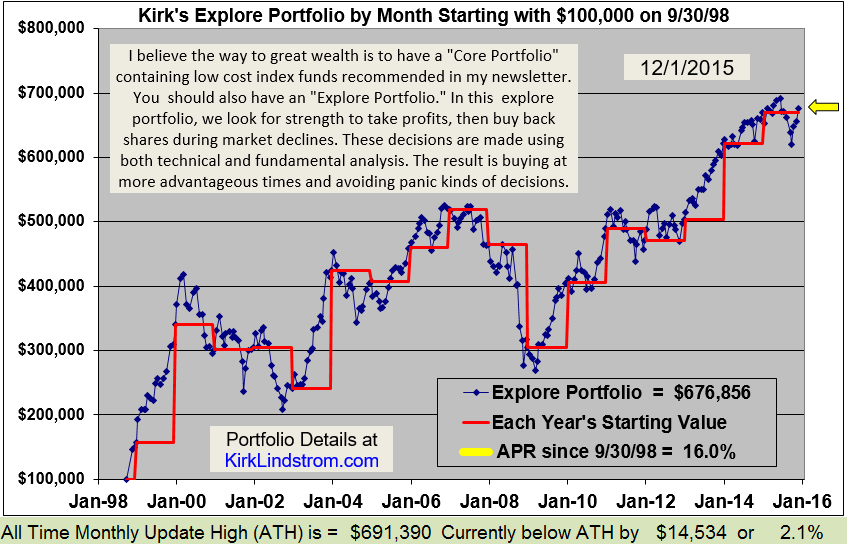
Doubled Money in a Down Market!

Since 12/31/98 "Kirk's Newsletter Explore Portfolio" is UP 114% (over a double!) vs. the S&P500 DOWN 9.2% vs. NASDAQ down 14.0% vs. Warren Buffett's Berkshire Hathaway (BRKA) up 28.1% (All through 7/16/09.)

As of July 16, 2009, "Kirk's Newsletter Explore Portfolio" is up 10.2% YTD vs. DJIA down 0.7% vs S&P500 up 5.7% YTD

HURRY! Subscribe NOW and get the July 2009 Issue for FREE! !
(Your 1 year, 12 issue subscription will start with next month's issue.)

Tuesday, January 20, 2009

S&P Trying to Fill Open Gap

You can see the open gap in the S&P 500 futures at 792:

A good number of traders will sit on that gap and wait for it to fill before going long while others will wait to see if the prior low is tested successfully first.

You can also see the gap in SPY, the S&P500 Spider (more SPY Charts) ETF :


Followers - Click "follow" to get an email alert for new articles

Kirk Lindstrom's Investment Letter Performance