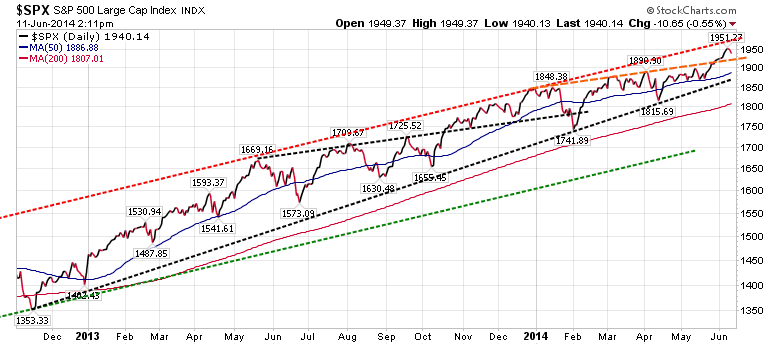
Note that this second chart shows a similar break above a trend line in October 2013 that was tested from above once in November 2013 before the market rallied all the way up to the dashed red resistance line.
Support Levels for S&P500
- About 1930
- The 50 DMA (day moving average) currently at 1887
- The dashed black trend line at about 1825
- The 200 DMA currently at 1807
- About 1975
Learn the "Core and Explore" approach to investing
with "Kirk Lindstrom's Investment Letter"
with "Kirk Lindstrom's Investment Letter"
Subscribe NOW and get the June 2014 Issue for FREE! !
(Your 1 year, 12 issue subscription will start with next month's issue.)
(More Info, Testimonials & Portfolio Returns)
(Your 1 year, 12 issue subscription will start with next month's issue.)
(More Info, Testimonials & Portfolio Returns)
Note how the DOW remains below its long-term trend lines.
Is it too late to buy stocks? No! It is hard to believe how many individual investors are still under invested in stocks. Two bear markets that took the S&P500 down over 50% each time between 2000 and 2009 scared many into cash and bonds. Most are only starting to get back into stocks. The fear may take a generation, or at least 20 years, for investors to return to "proper asset allocations."
- You can pay for the newsletter for a year with one successful Explore Portfolio trade and then follow the core portfolios essentially for free.


No comments:
Post a Comment