Don't Miss Out On Great Gains! - Best Investment Newsletter


Click for FREE sample of Kirk Lindstrom's Investment Letter

Don't miss out! Subscribe Now

google.com, pub-7001134751860982, DIRECT, f08c47fec0942fa0

Search For More

Saturday, December 31, 2016

Kirk Lindstrom's Article List for 2016


2016 (Articles in Red are KEY)

Dec 05 State and Local Sales Tax Rates for 2016 - Chicago, IL has the highest
Dec 03 State Income Tax Rates Map For 2016 California has highest rate @ 13.3%
Nov 02 2CS Sentiment Indicator Falls Below 30 
Nov 02 Rates Up To 6.41% Now For Series I Treasury Bonds I Bonds at 2.76%
Oct 26 2017 Social Security COLA: Cost-of-Living Adjustment (COLA) for 2017
Oct 11 Special Promotion for LinkedIn & Facebook - Get October's Issue for Free
Sept 30 Citigroup's Panic - Euphoria Model is back in its "Panic" Zone
Sept 8 2016 Year End S&P500 Price Targets for Major Wall Street Firms
Sept 7 Bob Brinker's Market Update for September 2016
Aug 25 SPY 1% Off Record High While Market Sentiment Continues Recovery
July 7 How Long Will You Live? Life & Death Issues - Life Expectancy
May 29 US Treasury Interest Rates vs S&P500 - Interest Rates vs the Stock Market
May 09 Jets.com Jet Card Pricing
April 11 Best CD Rates - Highest CD Rate Survey for April 2016
April 07 Newest Sentiment Indicator Very Bullish For SPY Even After a 14% Gain
Apr 03 Citigroup's Panic/Euphoria Model from Citi Investment Research
Mar 14 Make Money In A Flat Market With Asset Allocation & Market Volatility
Mar 13 Winning the Zigs, losing on the Zags - Why small investors usually do poorly
Mar 13 Jim Cramer's "Action Alerts Plus" Charitable Trust Portfolio Performance
Mar 10 SPY Up 10.1% Since The Tradable Low - Resistance At 200 Day MA
Mar 03 SPY Up 9.5% Since The Tradable Low - Buy Pullbacks Or Sell?
Feb 28 Fed Funds Interest Rates vs. S&P500 Index
Feb 26 SPY Continues Rally After Sentiment Charts Suggested Tradable Low
Feb 23 2CS Indicator Back Above 20 After Market Rallies 7.5%
Feb 18 SPY Up Sharply Since Sentiment Charts Suggested Tradable Low
Feb 11 With SPY Down 14% Again, Sentiment Charts Suggest Tradable Low
Feb 04 With SPY Still Down 10%, Sentiment Charts Suggest A Tradable Bottom
Jan 31 Los Altos Real Estate - Home prices gain another 15.7% in 2015
Jan 26 Tom Drake's 2CS Sentiment Indicator - Buy Signal
Jan 14 Sentiment Charts Reaching Blood In The Street Levels - SPY Down 11%
Jan 14 Timer Digest Market Timer of the Year Awards - 3rd Place long & short term
Jan 08 New Issue CD Rates At Fidelity
Jan 07 Star One Credit Union Savings Account and CD Rates
Jan 07 Weekly Sentiment Charts Falling With SPY Down 8%

Kirk Lindstrom's Investment Letter
 Subscribe NOW and get the Current Month for FREE!!!
[Just mention this ad for the special deal!]
(My SPECIAL ALERT emails will begin immediately plus access to all past issues while your 1 year, 12 issue subscription will start with the December issue.)


2016 KirkLindstrom.com Article List

Articles in Red are KEY

Feb 28 Fed Funds Interest Rates vs. S&P500 Index 
Feb 26 SPY Continues Rally After Sentiment Charts Suggested Tradable Low 
Feb 23 2CS Indicator Back Above 20 After Market Rallies 7.5%
Feb 18 SPY Up Sharply Since Sentiment Charts Suggested Tradable Low 
Feb 11 With SPY Down 14% Again, Sentiment Charts Suggest Tradable Low 
Feb 04 With SPY Still Down 10%, Sentiment Charts Suggest A Tradable Bottom 
Jan 31 Los Altos Real Estate - Home prices gain another 15.7% in 2015
Jan 26 Tom Drake's 2CS Sentiment Indicator - Buy Signal
Jan 14 Sentiment Charts Reaching Blood In The Street Levels - SPY Down 11%
Jan 14 Timer Digest Market Timer of the Year Awards - 3rd Place long & short term
Jan 08 New Issue CD Rates At Fidelity 
Jan 07 Star One Credit Union Savings Account and CD Rates
Jan 07 Weekly Sentiment Charts Falling With SPY Down 8%

Friday, December 30, 2016

US Stock Market Summary for 2016

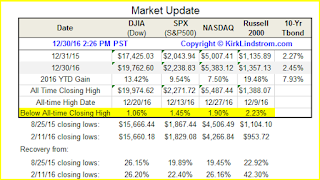
Market Update -  The US stock markets all made record highs this month and closed the year less than three percent below those record highs.  This table summarizes the data:
Click images to see full size

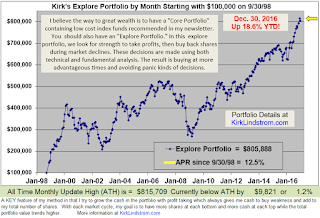
This graph shows the market data graphically for 2016 through 12/30/16.
Note the table above shows:
  • The S&P500 is 22.40% from its February 11th closing low, the day I wrote this free article "With SPY Down 14% Again, Sentiment Charts Suggest Another Tradable Low"
  • The Russell 2000 (small cap index) is up 42.30% since the February 11th low.
  • I didn't just write about this being a great time to buy, I sent out special alert emails to my newsletter subscribers while the market was bottoming in January and February as this summary of my email headers shows:
  • Feel free to verify with my subscribers who post on my Kirk Lindstrom's Investment Letter Facebook Page.
 This graph shows the S&P500 ETF SPY and its dividend back to 1992.

This graph puts the Dow Jones Industrial Average into perspective using a log chart.  Many pundits on TV say lowering the corporate tax rate will allow hundreds of billions of dollars to return to the US where some will be used for share buybacks.  This buying by companies plus scared bond investors looking for return, could easily drive the Dow back to the center blue line... of course a bear market could also drive it to the lower blue line first so I take profits at new highs to have funds to buy the declines and thus beat the market over time like very few others have.

Kirk Lindstrom's Investment Letter:
Subscribe NOW & get the December 2016 Issue for FREE!!! 

Congratulations to everyone who is in the stock market this year!
Happy New Year!

Thursday, December 29, 2016

KEYS Keysight TA - Bull Flag & Inverted Head & Shoulders

Keysight Technologies Inc. Technical Analysis
Bull Flag & Inverted Head & Shoulders Patterns
Click charts for full size images
Subscribe to my Newsletter NOW &
get
 the December 2016 Issue for FREE!!
This chart shows KEYS is up 29.26% YTD with a bull flag pattern stretching from mid November through today.
Bull Flag 
This next chart shows KEYS has an "Inverted Head & Shoulder" pattern stretching from May 2015 through mid September 2016.  The break of this dashed blue neckline was bullishly tested from above in October 2016 before the big jump to $38 in November 2016.
Inverted Head & Shoulders Pattern
Here is a great "Pro" article at Seeking Alpha "Keysight Technologies: An Intriguing Bull Case, But It Looks Priced In"  that basically says "Keys was a great buy when Kirk was buying in the $20s and low $30s but not so great now after he took profits!"
I believe one reason we are seeing a major "pause" here is Fidelity's Joel Tillinghast said in March that he would stop buying it for his stellar $35B "Fidelity Low-Priced Stock fund" at $35 so he's probably done what I did and take some profits. See Barrons "Fidelity’s Tillinghast: How He Beats the Market"
"Keysight can improve its profitability as a stand-alone company and might possibly be an interesting acquisition. Oftentimes, the second part of the story to spinoffs is that they get reacquired. It might be, by another instrument company. Keysight trades at $26 and is earning not quite $3. On a quarter-to-quarter basis, growth looks a little volatile, but less so on a yearly basis."
I was fairly aggressive buying KEYS for my "Explore Portfolio" in the low $30s and $20s and have already taken some profits with a break-even price now down to $26.47.
and get the December 2016 Issue for FREE!!


Wednesday, December 28, 2016

Kirk's Irrational Exuberance & Pessimism Chart for the Dow DJIA

Below is my chart of Dow Jones Industrial Average Index (Dow or DJIA) trend lines with "Irrational Exuberance" and "Irrational Pessimism" charted from 1980 through today.
Click image for full size chart
More Dow charts
and get the December 2016 Issue for FREE!!
Newsletter Explore Portfolio Performance


Saturday, December 10, 2016

US Stock Markets All Make New Record Highs

Market Update - US Stock Markets All Made New Record Highs!!! 
Click images to see full size

On Friday December 9, 2016 all major U.S. stock market indexes closed at new record highs.
  Note the table above shows:
  • The S&P500 is 23.53% from its February 11th closing low, the day I wrote this free article "With SPY Down 14% Again, Sentiment Charts Suggest Another Tradable Low"
  • The Russell 2000 (small cap index) is up 45.54% since the February 11th low.
  • I didn't just write about this being a great time to buy, I sent out special alert emails to my newsletter subscribers while the market was bottoming in January and February as this summary of my email headers shows:
  • Feel free to verify with my subscribers who post on my Kirk Lindstrom's Investment Letter Facebook Page.
This graph shows the market data graphically for 2016 YTD.
 This graph shows the S&P500 ETF SPY and its dividend back to 1992.
This graph puts the Dow Jones Industrial Average into perspective using a log chart.  Many pundits on TV say lowering the corporate tax rate will allow hundreds of billions of dollars to return to the US where some will be used for share buybacks.  This buying by companies plus scared bond investors looking for return, could easily drive the Dow back to the center blue line... of course a bear market could also drive it to the lower blue line first so I take profits at new highs to have funds to buy the declines and thus beat the market over time like very few others have.

Kirk Lindstrom's Investment Letter:
Subscribe NOW & get the December 2016 Issue for FREE!!! 


Monday, December 05, 2016

State and Local Sales Tax Rates Map for 2016

State and Local Combined Sales Tax Rates for 2016

This graphic shows the estimated, combined state and local sales tax rates for all 50 US states for the 2016 tax year.
These five states do not have statewide sales taxes: 
  1. Alaska, 
  2. Delaware, 
  3. Montana, 
  4. New Hampshire, and 
  5. Oregon. 
Of these, Alaska and Montana allow local cities and/or counties to charge local sales taxes.

California (aka Taxifornia) has the highest state sales tax at 7.5% but 1% of that must be distributed to local cities so you could argue it should only be 6.5% on that map.

When you add in local taxes, several places have higher combined tax rates than California such as the city of Chigago with a combined sales tax rate of 10.25%

For more, see "State Income Tax Rates Map For 2016" California has highest rate @ 13.3%

 Kirk Lindstrom's Investment Letter
Don't Miss Out!

For more information and details by state in tabular form, see State and Local Sales Tax Rates in 2016 at TaxFoundation.org
 Walczak, Jared. “Chicago Adopts Highest Sales Tax Among Major Cities.” Tax Foundation. July 16, 2015. http://taxfoundation.org/blog/chicago-adopts-highest-sales-tax-among-major-cities.

Saturday, December 03, 2016

State Income Tax Rates Map For 2016

This graphic shows the state income tax rates for all 50 US states for the 2016 tax year.
The top rate is California with 13.3%!!

The bottom rate is a tie with 7 states that have no state income taxes.

 Kirk Lindstrom's Investment Letter
Don't Miss Out!

Monday, November 21, 2016

All Major US Stock Markets Set Record Highs Today

What a great year for stock market investors!

Today all major US stock markets closed at new record highs!


The above table shows the Russell 2000 small cap index is up 38.6% from its Feb. 11, 2016 closing low when I wrote there was a ANOTHER tradable low. 
I made great money buying the first low in 2015, taking profits as the markets recovered then bought again when the market was testing that low in early 2016.

Kirk Lindstrom's Investment Letter:
Subscribe NOW & get the November 2016 Issue for FREE!!!


Speed of Light Equals Great Pyramid of Giza Egypt Coordinates

This is fascinating how you can put a decimal point after the first digit of the speed of light and it gives you the Northern Latitude for the oldest Egyptian pyramid.  


The Great Pyramid of Giza is the oldest and largest of the three pyramids in the Giza pyramid complex bordering what is now El Giza, Egypt. It is the oldest of the Seven Wonders of the Ancient World, and the only one to remain largely intact. Wikipedia


Speed of light - Wikipedia 

https://en.wikipedia.org/wiki/Speed_of_light


The speed of light in vacuum, commonly denoted c, is a universal physical constant important in many areas of physics. Its exact value is 299792458 metres per second (approximately 3.00×10⁸ m/s), since the length of the metre is defined from this constant and the international standard for time.

One light year‎: ‎1.0 year
Miles per second‎: ‎186000
Astronomical units per day‎: ‎173
Metres per second‎: ‎299792458


It is fun to read how some try to debunk this:

But they seem to leave out some other explanations:
  1. A higher power sending a message to us
  2. Gremlins:  Mr. Love, my 8th grade advanced science teacher who later taught the MGM program for the district taught us to attribute everything to "gremlins" then use science to come up with a more plausible explanation. 
  3. "Space Aliens" visited the Earth and helped construct the Great Pyramids.  They used coordinates that would someday leave a message to a more advanced people that they visited our planet and perhaps even helped us survive as a species.
  4. Other?


Wednesday, November 02, 2016

2CS Sentiment Indicator Falls Below 30

The 2CS Indicator History as of today's market close has fallen into what has typically been a very good "buy zone" for those with patience.   

When used as a contrarian indicator, the scale on my graph below runs from 0 to 100% with 0% the maximum bullish reading and the 100% maximum bearish reading.
For more information, see my January 26, 2016 article:


Invented by Tom Drake, the 2CS is the five day moving average of the product of the VIX (CBOE Volatility Index) and its put to call ratio. On his blog posted titled, 2CS, Tom wrote:
“My favorite and simplest sentiment measure of the US stock market is the 2CS. Take each day's CBOE put/call ratio and multiply by each day's VIX or VXO (I have used the VXO since 1996). Sum the last five days of the daily product of VXO times P/C. When that five day total or 2CS gets under 70 we can start to wonder about the possibility an intermediate term top somewhere ahead. Sometimes the market will stall or go sideways a bit and relieve this condition, and then go higher again. But sometimes 2CS will continue to fall as the market moves up and get below 60. 2CS below 60 is almost always indicative of a significant decline within a week or two.”
Here is another version I call my "Hybrid 2CS"

In the past two years, buying the S&P500 when the 2CS was under 30 has yielded good results within a few months. Buying when under 20 has produced even better results.Will this trend continue?

More data:  2CS from 2003 to Aug 2009


Kirk Lindstrom's Investment Letter
 Subscribe NOW and get the October 2016 Issue for FREE!!!
(Your 1 year, 12 issue subscription with SPECIAL ALERT emails will start with next month's issue.)


Followers - Click "follow" to get an email alert for new articles

Kirk Lindstrom's Investment Letter Performance