
This market update chart shows the Dow, S&P500 and Nasdaq all have positive returns this year with only the Russell 2000 small cap index in the red at down 1.79%.


Correction Statistics

Check this for a 10-day scan of the major markets. Refresh during the day and you can watch the market action unfold.
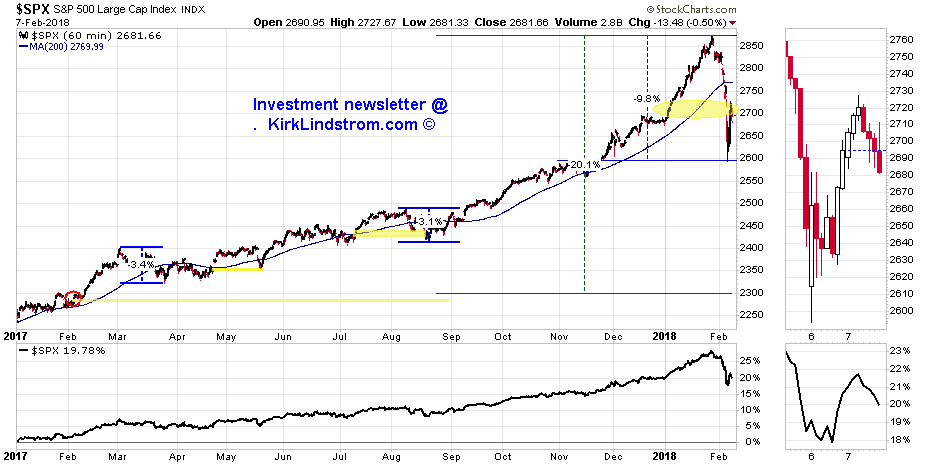
Here is what it looks like as of the end of today.

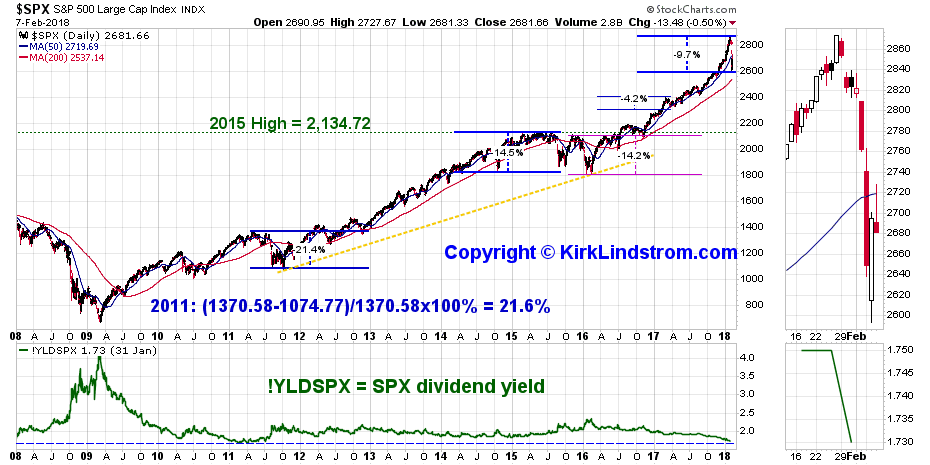
Here is a closer look at the S&P 500 showing we just had the biggest market decline since the two 14% declines in late 2015 and early 2016.
Here is what it looks like as of the end of today.

Here is a closer look at the S&P 500 showing we just had the biggest market decline since the two 14% declines in late 2015 and early 2016.
Many on TV blame the decline on higher interest rates. This chart shows the 10-year US treasury rate vs the Dow.

Here are some of my sentiment charts that are "starting to get interesting" after flashing wonderful warning signals before the current market decline.


These two give some historical perspective on the Fear and Greed index.


Did you buy (or add to positions) when the market was down and sentiment was horrible?
I did.
Did you take profits by selling some highly appreciated stocks to have funds to put in during this current decline?
I did.
I did.

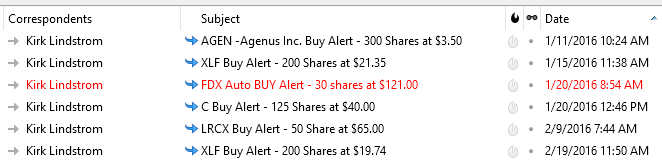
To get my "Special Email Alerts" and the "Auto Buy Sell Table" where I list ahead of time what stocks to buy at what prices during this decline,
Kirk Lindstrom's Investment Letter

(My SPECIAL ALERT emails will begin as soon as I get payment via check or PayPal)


 kirklindstrom.com

No comments:
Post a Comment