Don't Miss Out On Great Gains! - Best Investment Newsletter


Click for FREE sample of Kirk Lindstrom's Investment Letter

Don't miss out! Subscribe Now

google.com, pub-7001134751860982, DIRECT, f08c47fec0942fa0

Search For More

Showing posts with label US Treasury Rates. Show all posts

Saturday, July 22, 2023

US Treasury Rates, Graphs & Yield Curve

 US Treasury Interest Rate graphs through 7/21/23


US Treasury Yield Curve
from https://www.ustreasuryyieldcurve.com/ 


 US Treasury Interest Rates

From https://home.treasury.gov/ 


TIPS:


Kirk Lindstrom's Investment Letter

To see what stocks and ETFs are in my "Explore Portfolio" and get a full list of on my price targets to both take profits or buy more:
 Subscribe NOW  and get
the
 July 2023 
Issue for FREE!!! 
(If you mention this ad)


Sunday, October 02, 2022

US Treasury Interest Rate Graphs

 US Treasury Rates through 9/30/22


TIPS Core Yield vs S&P 500 through 9/30/22

CPI vs Fed Funds Rate vs Expected 10-Yr Inflation - 9/30/22  
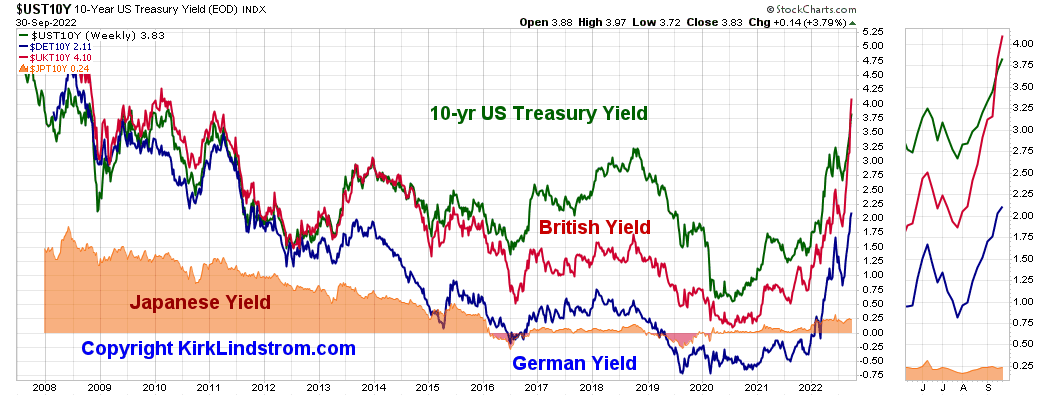
10 Year Rates: US vs European & Japan
BND vs SCHZ & AGG
BND - Not adjusted for dividends


Saturday, April 30, 2022

US Treasury Interest Rates Soaring

4/30/22:  With CPI-U annual inflation running at 8.5%, interest rates are soaring.  The Fed appears to be "behind the curve" such that expected inflation defined as the difference between the 10-year TIPS and T-Bond rates. has soared to 2.88%, near its high for my calculations going back to 2004. 

US Treasury Interest Rates Graph

US Fed Funds Rate vs. S&P 500   

CPI vs Fed Funds Rate vs Expected 10-Yr Inflation

LIBOR Rates from 1993 to 4/30/22

Kirk Lindstrom's Investment Letter Service

Saturday, February 26, 2022

US Treasury Interest Rates

 US Treasury rates are slowly inching higher in anticipation of the Federal Reserve's March meeting where most pundits expect the Fed will: 

  • End QE bond buying by "reducing the pace" to zero
  • Raise interest rates by 0.25% to 0.50%

US Treasury Interest Rates through 2/25/2022

LIBOR Rates from 1993 to 2/26/22

TIPS Core Yield vs S&P 500 through 2/25/22

Kirk Lindstrom's Investment Letter Service

Monday, March 25, 2019

Relationships between Treasury Rates, Yield Curve Inversions, Recessions and the Stock Market

Here are some charts showing clear relationships between US Treasury rates, yield curve Inversions, recessions and the Stock Market.

This is the curve that has so many talking about inversion with the 3-month US treasury paying 0.02% more than the 10-year US Treasury.


Yield Curve 10yr - 3Mo
This is the curve that looks out 30 years compared to 1 year:
Yield Curve 30yr-1yr

Yield Curve:  30yr / 3Mo

Rates 10 & 30 Year USTs


Don't miss out!

And get the March Issue for FREE!

Speaking about yield inversion, Art Cashin, UBS Director of Floor Operations, said on CNBC on 3/25/19:
Every inversion is not followed by a recession but every recession is proceeded by an inversion.  So is it worrisome, Yes?  Is it a guarantee?  No.
S&P 500 Chart:

Friday, March 01, 2019

New Record High, Interest Rates & CPC Investor Sentiment Indicator

Weekend Market Update
 After making bear market lows, down 20% or more during the Christmas Holiday, the four major US stock market indexes soared such that they are only down between 2.99% and 8.70% from their record highs.

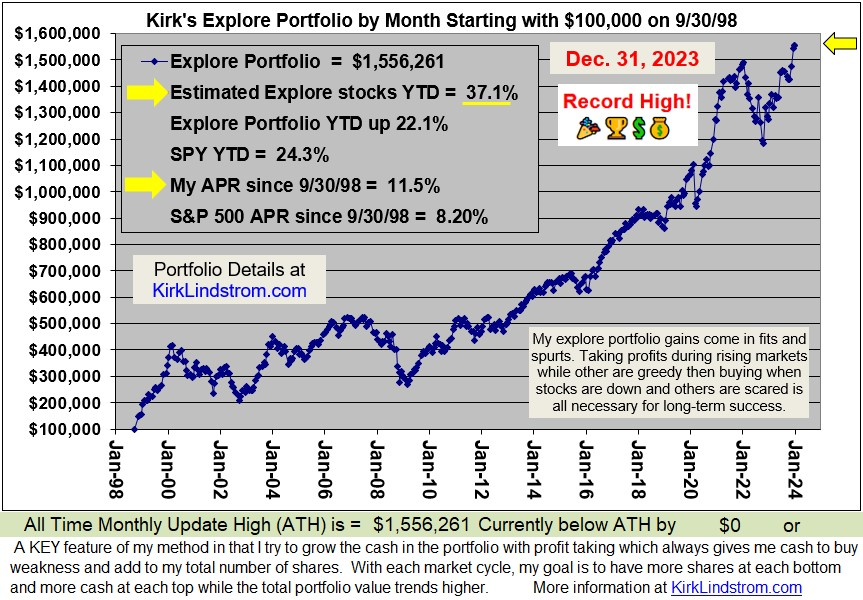
The "Explore Portfolio" covered in Kirk Lindstrom's Investment Letter today closed at another record high!

 Subscribe NOW
and get the February 2019 Issue for FREE!!!
Interest rates are up but still very low on an historical basis.
After doing a lot of buying around the holidays when the markets were near their lows, my CPC Put/Call sentiment indicator is now well into the "take profits" zone.

To understand more about my method, please read these KEY articles:
Discuss this article on my "Investing for the long term" Facebook group. 
.

Thursday, February 15, 2018

2CS & CPC Charts Still Show High Fear Levels

Kirk's Stock Market & Sentiment Charts for February 15, 2018.

This market update chart shows the Dow, S&P 500, Nasdaq and Russell 2000 small cap index are now all back in the green for the year.

Click "Follow" at the bottom of this blog to get FREE email notifications from Google's Blogger when I post new updates.

This chart shows the depth of the correction for the major averages.  How many who said they would buy after a 10% correction showed up?  It looks like some sure did!
This chart shows the S&P 500 has rallied to its 50-day moving average, MA(50), after correcting down to its MA(200).
This chart shows the Dow corrected down to the dotted orange trend line before bouncing.

 These sentiment charts show that even after a big recovery, there is still plenty of fear remaining.


Can you guess when I will draw the next green dot?
Fear and Greed index starting to recover.

 This inverted head & shoulder plot is very exciting.

Did you buy anything during the market decline? 

I did.  Here is part of one of my special email alerts I sent my subscribers:


Click "Follow" at the bottom of this blog to get FREE email notifications from Google's Blogger when I post new updates.

To get my "Special Email Alerts" and the "Auto Buy Sell Table" where I list ahead of time what stocks to buy at what prices during this decline,  
 Subscribe NOW  and get
the
 February 2018 
Issue for FREE!!!
Kirk Lindstrom's Investment Letter
(My SPECIAL ALERT emails will begin as soon as I get payment via check or PayPal)

Followers - Click "follow" to get an email alert for new articles

Kirk Lindstrom's Investment Letter Performance