
Bradley Turn Points - Bradley Dates July 2025 through December 31, 2025

Compliments of Breeze


Here are some charts of the Trading Signal SOX vs CLX on the SOX


Thanks to Luka for posting the daily CLX data.
Kirk Lindstrom's Investment Letter


Kirk Lindstrom's Investment Letter


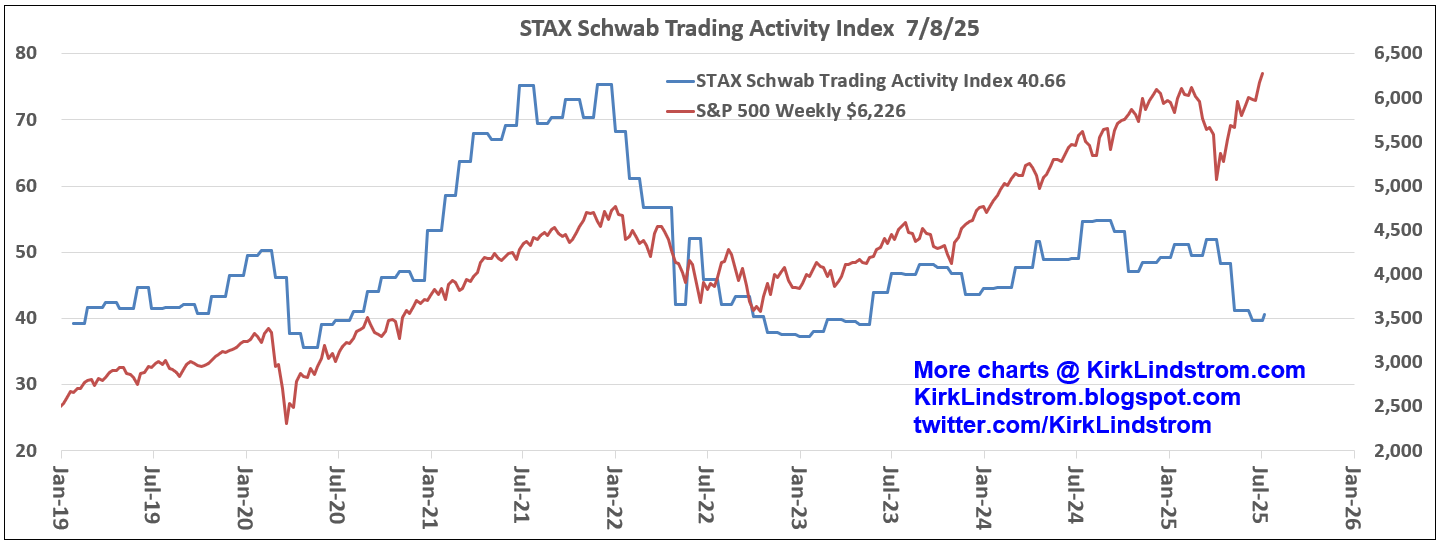 |
| Schwab Trading Activity Index |
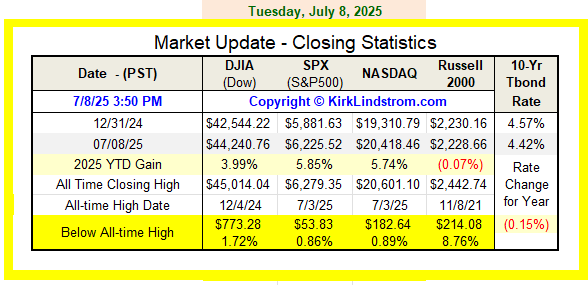 |
| Market Update |
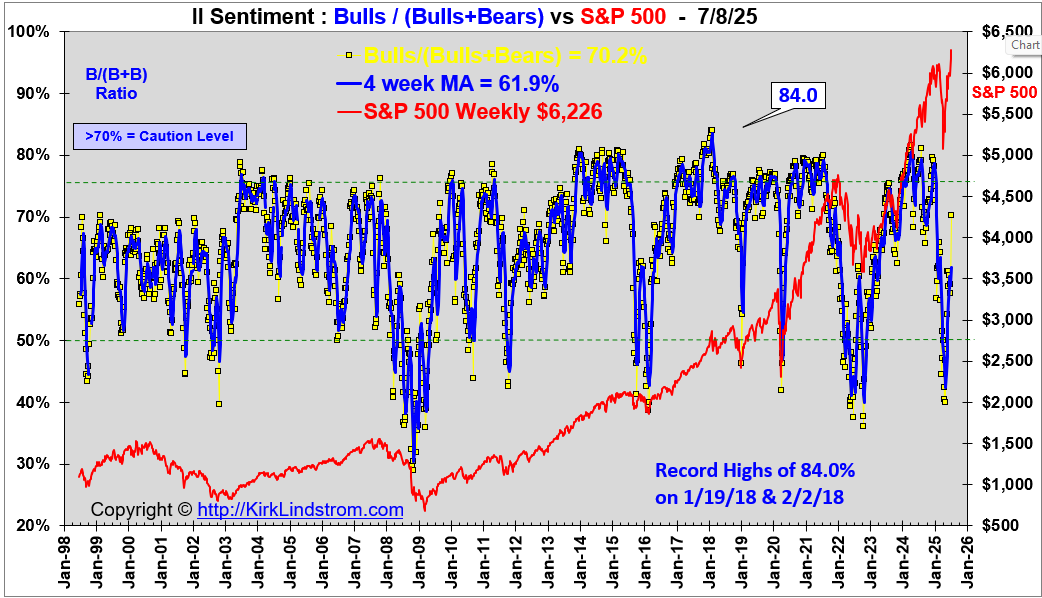 |
| II Bulls Over Bulls Plus Bears 1998 to Now |
Kirk Lindstrom's Investment Letter

2C-p = 8.9 and rising from a low of 1.4 on 4/10/25
Invented by Tom Drake, the 2CS-p is the "5 day moving average of the product of the vix and p/c ratio." The scale runs from 0 to 100% with 0% max bullishness and 100% max bearish reading for us contrarians.


In my case they are ranked from today all the way back to Feb 10, 2003, the earliest I have data for. So, in a nutshell if yesterday's 2c-p was 7.8% (which it is) that tells you that only 7.8% of the sum of the 5-day p/c x vix (aka the 2c-p) is lower than yesterday's value."
To read what the sentiment indicators mean to me each month, subscribe to Kirk Lindstrom's Investment Letter


Graph shows January 2004 through March28, 2025


Kirk Lindstrom's Investment Letter
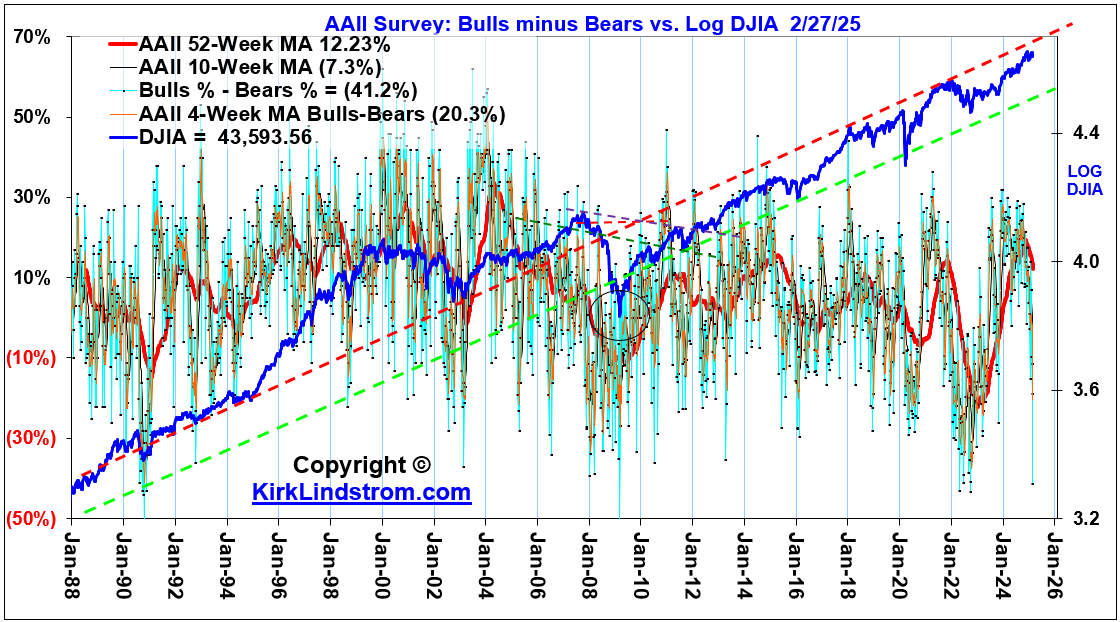
AAII Survey: Bulls minus Bears vs. Log DJIA - 1988 to Today


Kirk Lindstrom's Investment Letter


Here is a graph of the STAX Schwab Trading Activity Index Over Time, from January 2019 through Today.
Note that even with the markets at record highs last week, the STAX remains closer to a 6-year low than a 6-year high.
Click Images to See Full Size
Best in Full Screen


Kirk Lindstrom's Investment Letter


 kirklindstrom.com