Don't Miss Out On Great Gains! - Best Investment Newsletter


Click for FREE sample of Kirk Lindstrom's Investment Letter

Don't miss out! Subscribe Now

google.com, pub-7001134751860982, DIRECT, f08c47fec0942fa0

Search For More

Showing posts with label CPI-U. Show all posts

Saturday, March 29, 2025

CPI vs Fed Funds Rate vs 10-Yr US Treasury Note Rate Graph

 Graph shows January 2004 through March28, 2025


Graph shows July 2020 through March28, 2025:

Kirk Lindstrom's Investment Letter

To see what stocks and ETFs are in my "Explore Portfolio" and get a full list of on my price targets to both take profits or buy more:
 Subscribe NOW and get
the March 2025 Issue for FREE!!
(If you mention this ad)


Wednesday, June 12, 2024

May CPI at 3.3% Is Still Above Fed's 2.0% Target

 Despite President Biden's "Inflation Reduction Act of 2022" (estimated to contain $500B in new spending and tax credits) and the Federal Reserve keeping its Fed Funds Interest Rate at a 20-year high, inflation at 3.3% is 1.3% or 65% above the desired or "target rate" of 2.0%.

CPI-U: This morning the US Bureau of Labor Statistics announced, "The Consumer Price Index for All Urban Consumers (CPI-U) was flat in May on a seasonally adjusted basis, after rising 0.4 percent in April". and "Over the last 12 months, the all-items index increased 3.3 percent before seasonal adjustment."

Core CPI-U: "The index for all items less food and energy rose 0.2 percent in May, after rising 0.3 percent the preceding month" and "The all items less food and energy index rose 3.4 percent over the last 12 months."

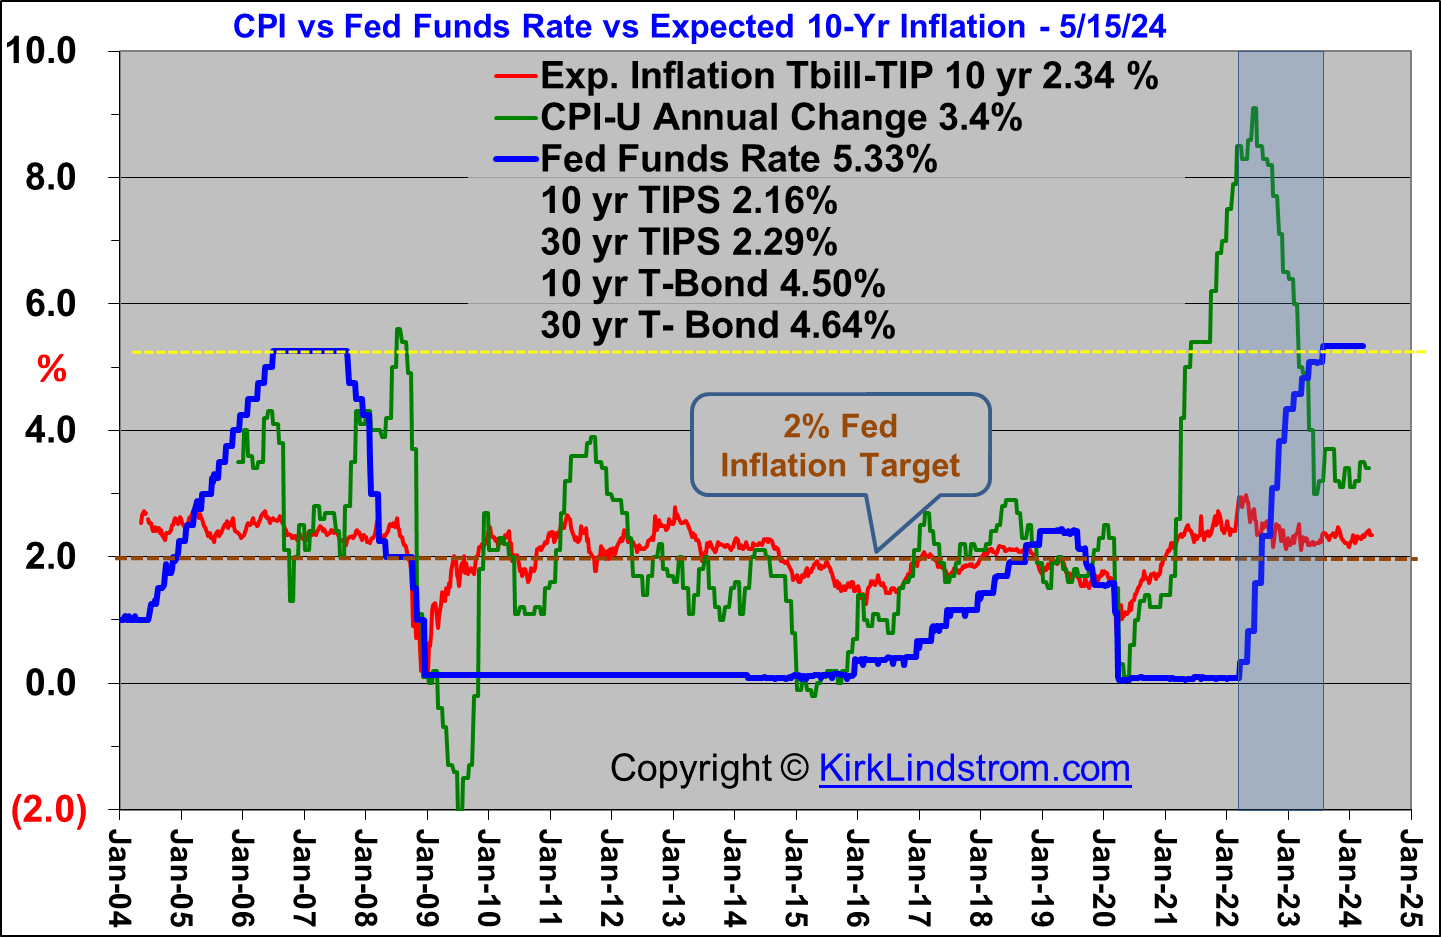
Chart: CPI vs Fed Funds Rate vs Expected 10-Yr Inflation from 2004


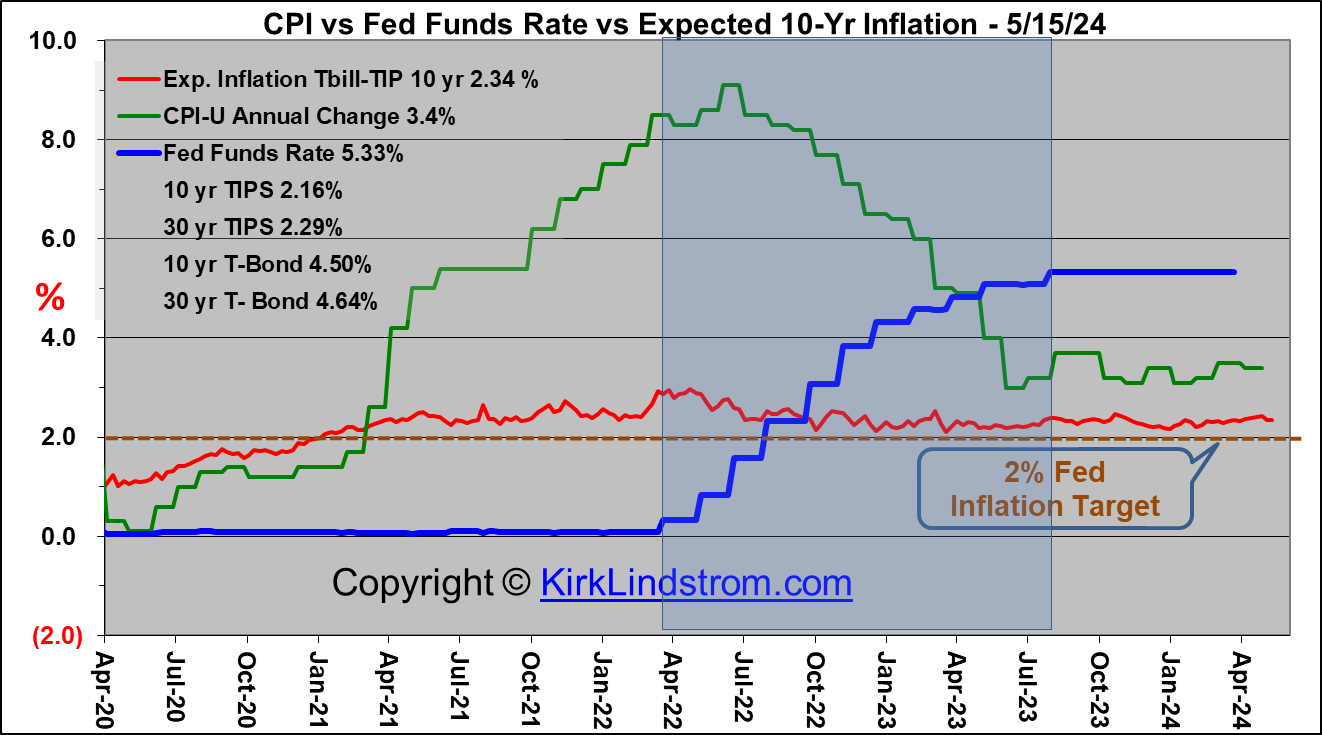
Chart: CPI vs Fed Funds Rate vs Expected 10-Yr Inflation from 2020


Table: Raw Inflation Data from November 2023:


Kirk Lindstrom's Investment LetterTo see what stocks and ETFs are in my "Explore Portfolio" and get a full list of on my price targets to both take profits or buy more:

Subscribe NOW  and get
the
 June 2023 
Issue for FREE!!


Wednesday, May 15, 2024

April CPI Still Hot at 3.4% vs Fed's 2.0% Target

Despite President Biden's "Inflation Reduction Act of 2022" (estimated to contain $500B in new spending and tax credits) and the Federal Reserve keeping its Fed Funds Interest Rate at a 20-year high, inflation at 3.4% is 1.4% or 70% above the desired or "target rate" of 2.0%.

CPI-U: This morning the US Bureau of Labor Statistics announced, "The Consumer Price Index for All Urban Consumers (CPI-U) increased 0.3 percent in April on a seasonally adjusted basis, after rising 0.4 percent in March". and "Over the last 12 months, the all items index increased 3.4 percent before seasonal adjustment."

Core CPI-U: "The index for all items less food and energy rose 0.3 percent in April, after rising 0.4 percent in each of the 3 preceding months." and "The all items less food and energy index rose 3.6 percent over the last 12 months."

Chart: CPI vs Fed Funds Rate vs Expected 10-Yr Inflation from 2004


Chart: CPI vs Fed Funds Rate vs Expected 10-Yr Inflation from 2020


Table: Raw Inflation Data from October 2023


Chart: Fed Funds Interest Rate vs S&P 500 - 1993 through today

Chart: Fed Funds Interest Rate vs S&P 500 - 2019 through today


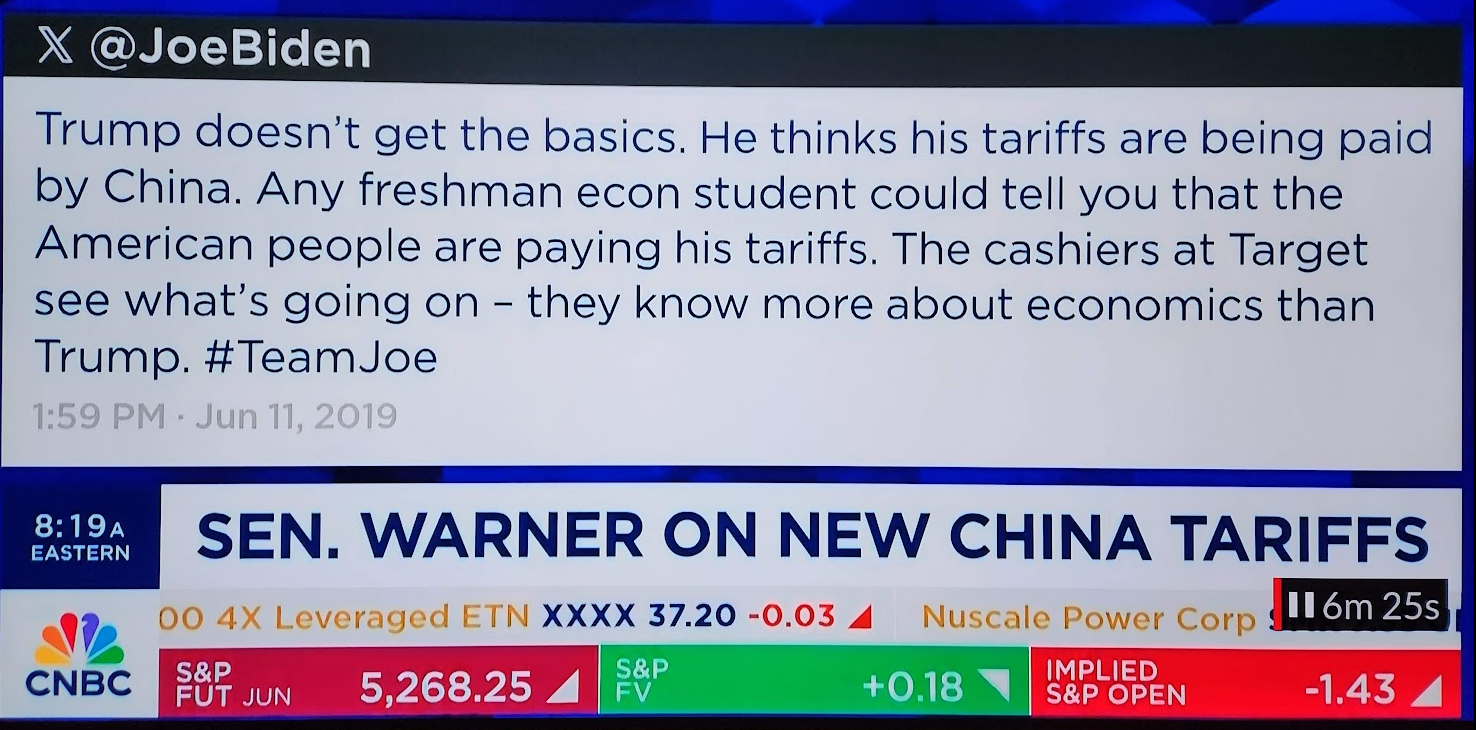
Tariffs and Inflation:  Perhaps I should have included President Trump's tariffs as a contributor to inflation stubbornly remaining above the desired 2.0% target.


If so, then President Biden's new tariffs will make inflation worse.

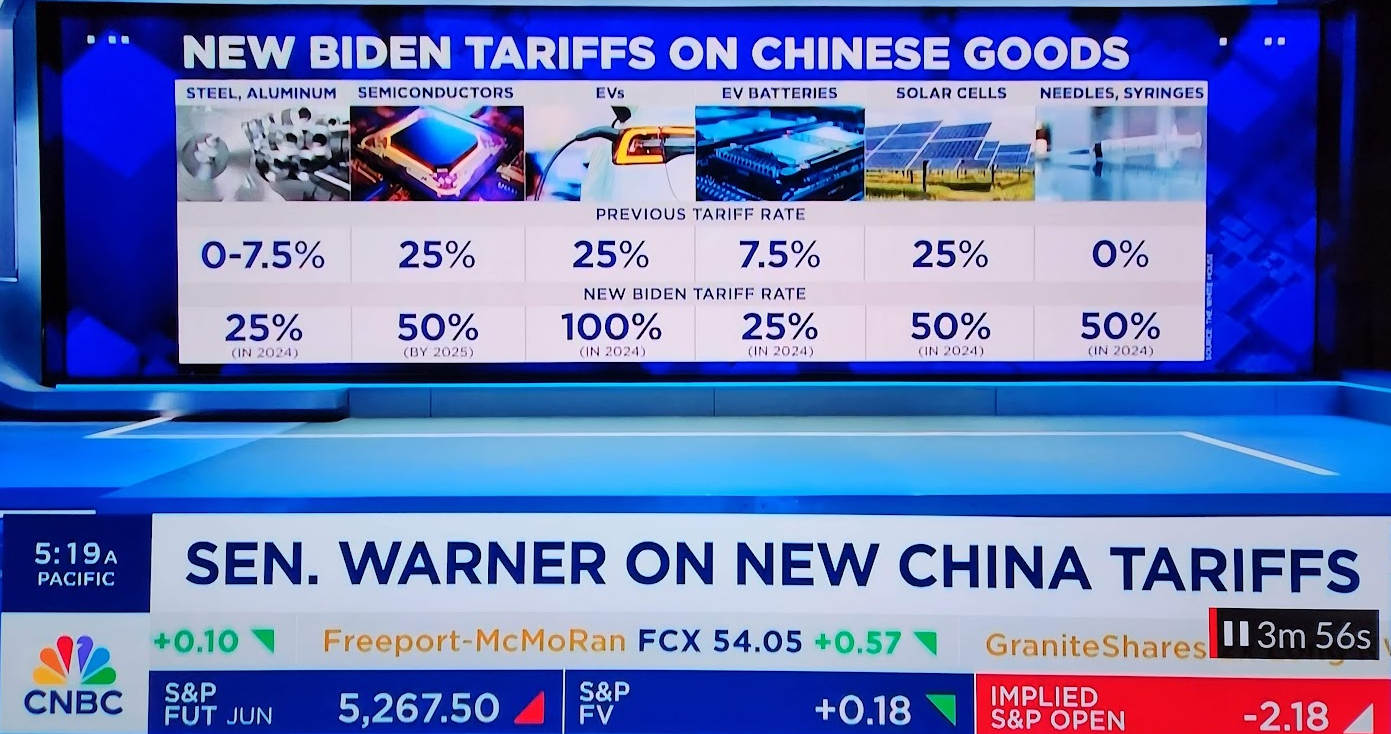
Yesterday President Biden announced new tariffs on goods manufactured in China. 
WASHINGTON, May 14 (Reuters) - President Joe Biden is hiking tariffs on $18 billion in Chinese goods including electric vehicles, batteries, semiconductors, steel, aluminum, critical minerals, solar cells, ship-to-shore cranes, and medical products, while retaining Trump-era tariffs on over $300 billion in goods. 
The United States Trade Representative's Office told Reuters it anticipates the effective date will be in approximately 90 days.


Spending $500B to "reduce inflation" and then implementing new tariffs then listening to others debate the merits...

Kirk Lindstrom's Investment LetterTo see what stocks and ETFs are in my "Explore Portfolio" and get a full list of on my price targets to both take profits or buy more:

Subscribe NOW  and get
the
 May 2023 
Issue for FREE!!


Discuss this article at my Investing for the Long Term Facebook group.

Sunday, October 16, 2022

Worst Inflation in 40 Years - Bear Market Continues

The bear market that began at the start of the year continues with all four major markets I follow down over 20% from their peaks.


It is hard to get excited about the economy when gasoline in CA is over $7 per gallon for regular in many areas with the "cheap stations" in the Silicon Valley over $6.00 per gallon.


🌡CPI up 8.2% in September📈🔥


Kirk Lindstrom's Investment Letter

To see what stocks and ETFs are on my buy list and what are my price targets:
 Subscribe NOW  and get
the
 October 2022 
Issue for FREE!!!
(If you mention this ad)

Friday, June 10, 2022

Welcome Back Carter - 8.6% Inflation is the Highest since 1981

CPI-U Inflation came in at 8.6% in May with core inflation at 6.0% over the past year.  The Energy Index rose 3.9% in May and was up 34.6% on the year. Gasoline rose another 4.1% in May and is up 48.7% on the year.  If you think buying a new, more fuel efficient ICE auto or EV will solve your inflation problem, think again as new car prices are up 12.6%, if you can get one, while used cars soared 16.1% on the year.

Chart 1. One-month percent change in CPI for All Urban Consumers (CPI-U)

CONSUMER PRICE INDEX - MAY 2022

The Consumer Price Index for All Urban Consumers (CPI-U) increased 1.0 percent in May on a seasonally adjusted basis after rising 0.3 percent in April, the U.S. Bureau of Labor Statistics reported today. Over the last 12 months, the all items index increased 8.6 percent before seasonal adjustment.

The increase was broad-based, with the indexes for shelter, gasoline, and food being the largest contributors. After declining in April, the energy index rose 3.9 percent over the month with the gasoline index rising 4.1 percent and the other major component indexes also increasing. The food index rose 1.2 percent in May as the food at home index increased 1.4 percent.  
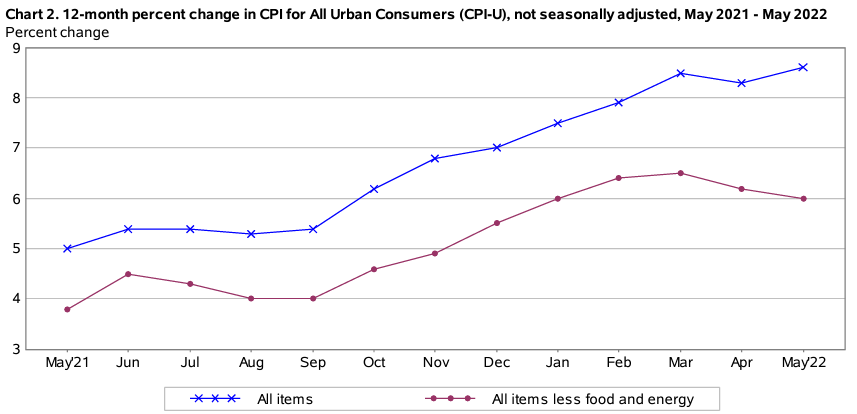
Chart 2. 12-month percent change in CPI for All Urban Consumers (CPI-U)


Table A. Percent changes in CPI for All Urban Consumers (CPI-U): U.S. city average

The index for all items less food and energy rose 0.6 percent in May, the same increase as in April. While almost all major components increased over the month, the largest contributors were the indexes for shelter, airline fares, used cars and trucks, and new vehicles. The indexes for medical care, household furnishings and operations, recreation, and apparel also increased in May. 

The all items index increased 8.6 percent for the 12 months ending May, the largest 12-month increase since the period ending December 1981. The all items less food and energy index rose 6.0 percent over the last 12 months. The energy index rose 34.6 percent over the last year, the largest 12-month increase since the period ending September 2005. The food index increased 10.1 percent for the 12-months ending May, the first increase of 10 percent or more since the period ending March 1981.


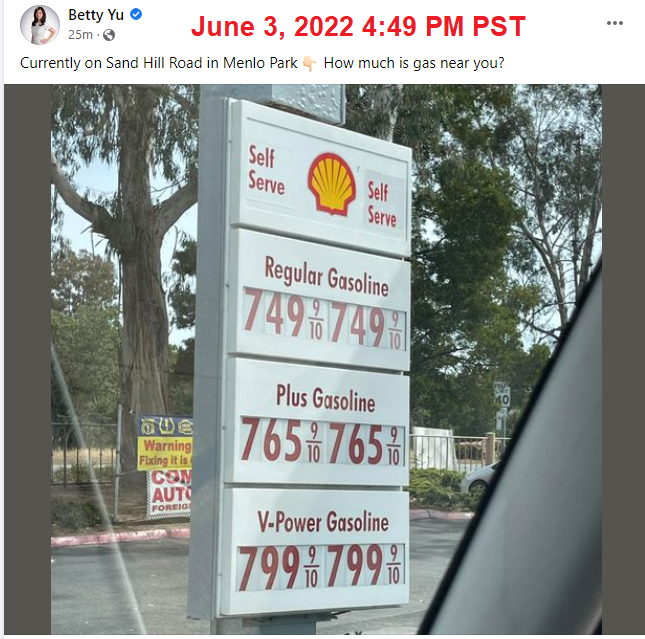
Gasoline Nearing Eight Dollars Per Gallon in Menlo Park California

Biden Barometer
 Natural Gas, Oil Price & Stock Market  Performance under President #46 Joe Biden

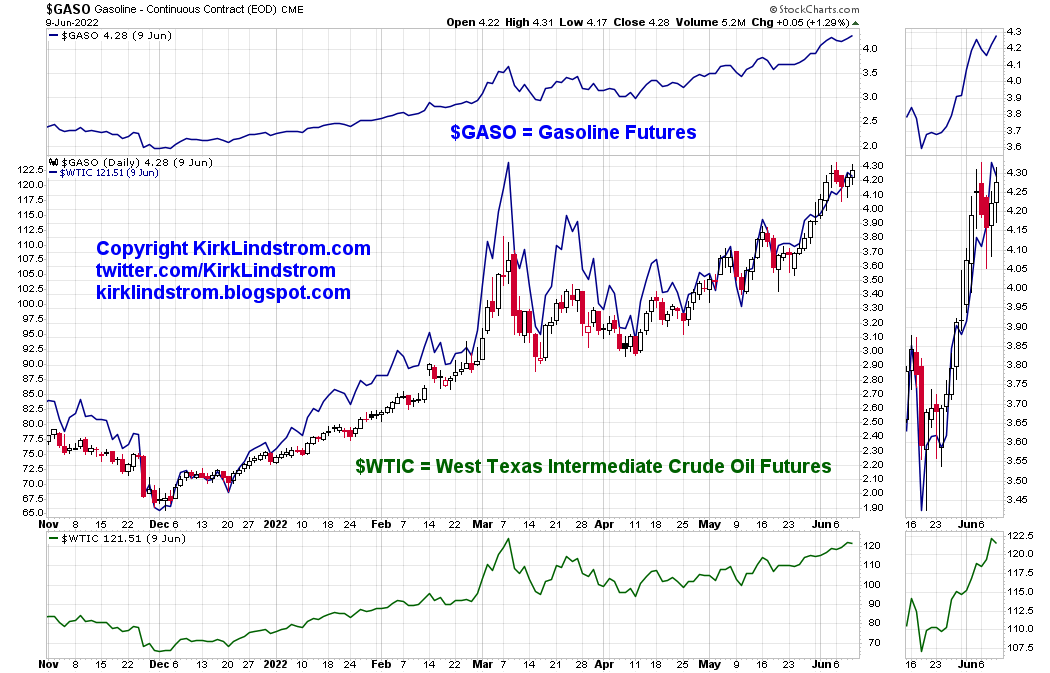
Sadly, I see little relief in the short term as gasoline prices have continued to soar in June.  Hopefully you followed my newsletter advice to own some US Treasury Series I Bonds that are currently paying us 9.62% for new issues and I own some that are paying  12.76% due to their base rate of 3.0% plus inflation.


Wednesday, May 11, 2022

Inflation Hot at 8.3% but Monthly Readings Much Lower with Energy Falling

CPI-U Inflation came in at 8.3% in April with core inflation at 6.2% over the past year.  Energy, up 30.3% year-over-year, fell 2.7% in April.  The 0.3% monthly change in CPI-U is the lowest since August 2021.

The Consumer Price Index for All Urban Consumers (CPI-U) increased 0.3 percent in April on a seasonally adjusted basis after rising 1.2 percent in March, the U.S. Bureau of Labor Statistics reported today. Over the last 12 months, the all items index increased 8.3 percent before seasonal adjustment.  

Increases in the indexes for shelter, food, airline fares, and new vehicles were the largest contributors to the seasonally adjusted all items increase. The food index rose 0.9 percent over the month as the food at home index rose 1.0 percent. The energy index declined in April after rising in recent months. The index for gasoline fell 6.1 percent over the month, offsetting increases in the indexes for natural gas and electricity. 

Table A. Percent changes in CPI for All Urban Consumers (CPI-U): U.S. city average
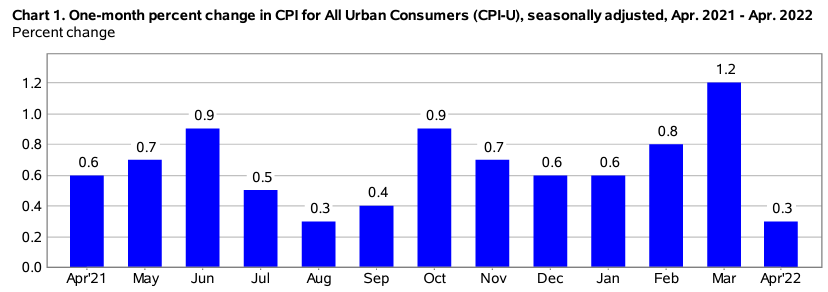
Chart 1. One-month percent change in CPI for All Urban Consumers (CPI-U), seasonally adjusted, Apr. 2021 - Apr. 2022

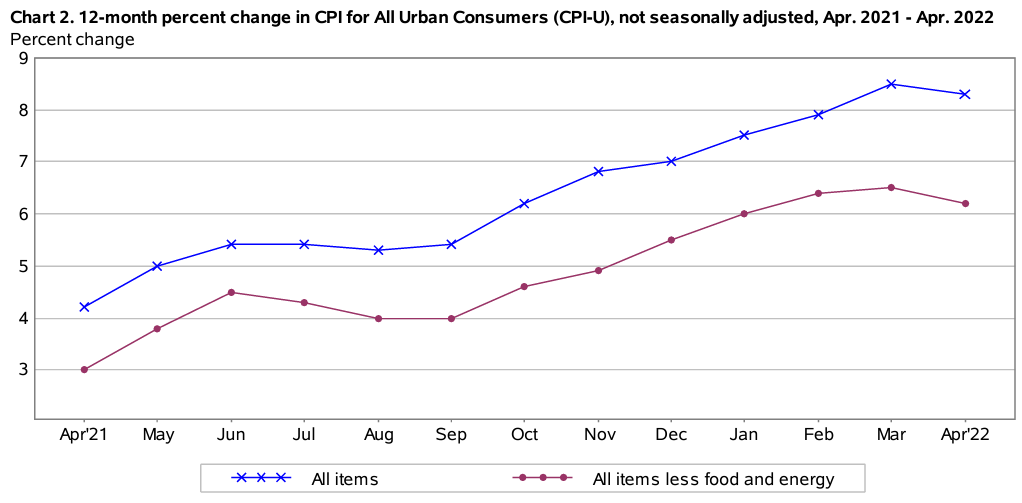
Green Shoots: Inflation MAY be peaking.  See Chart 2 below.  While the CORE inflation is higher than expected, the MONTHLY all items CPI-U number at 0.3% is the lowest BY FAR for the last six months with energy falling by 2.7%.  0.3% annualized is a much tamer 3.6% inflation.  Of course energy is up again this month so this will be hard to repeat without gasoline prices stabilizing or falling.
The index for all items less food and energy rose 0.6 percent in April following a 0.3-percent advance in March. Along with indexes for shelter, airline fares, and new vehicles, the indexes for medical care, recreation, and household furnishings and operations all increased in April. The indexes for apparel, communication, and used cars and trucks all declined over the month.

The all items index increased 8.3 percent for the 12 months ending April, a smaller increase than the 8.5-percent figure for the period ending in March. The all items less food and energy index rose 6.2 percent over the last 12 months. The energy index rose 30.3 percent over the last year, and the food index increased 9.4 percent, the largest 12-month increase since the period ending April 1981. 
Chart 2. 12-month percent change in CPI for All Urban Consumers (CPI-U), not seasonally adjusted, Apr. 2021 - Apr. 2022


Kirk Lindstrom's Investment Letter

 Subscribe NOW  and get
the
 May 2022 
Issue for FREE!!!


Followers - Click "follow" to get an email alert for new articles

Kirk Lindstrom's Investment Letter Performance