Don't Miss Out On Great Gains! - Best Investment Newsletter


Click for FREE sample of Kirk Lindstrom's Investment Letter

Don't miss out! Subscribe Now

google.com, pub-7001134751860982, DIRECT, f08c47fec0942fa0

Search For More

Thursday, June 26, 2014

Home Prices vs API Scores Los Altos, Palo Alto, Cupertino, Saratoga, Los Gatos, Mtn View and Sunnyvale

This table compares 2013 API Scores and Median Single Family Home Prices for some of the top school districts in the San Francisco Bay Area's Silicon Valley. 

Cupertino, home of Apple (AAPL), has the top score while its median home price is less than two million dollars.


School District - API Score - Median Single Family Home Price

Cupertino Union - 962 - $1,530,000    
Los Altos  -  961 -  $2,450,000  
Saratoga Union  - 959  - $2,280,000
Palo Alto Unified   - 932    $2,535,000  
Los Gatos Union  - 929 - $1,772,500
Mountain View / Whisman   -  863  - $1,420,000
Sunnyvale - 831 - $964,500
 This table has the above plus changes in median price over the last year and since the 2007.

From California Department of Education: Home » Testing & Accountability » Accountability » Academic Performance Index (API)


Academic Performance Index (API): The cornerstone of California's Public Schools Accountability Act of 1999; measures the academic performance and growth of schools on a variety of academic measures.
API Reports and Data Files

Sunday, June 22, 2014

Los Altos Home Prices for May 2014

This article shows:
  • Los Altos Single-Family Home Prices Sales List for May 2014
  • Los Altos Average Single-Family Home Prices
  • Los Altos Average Prices for Condos & Townhomes
  • The three portfolios in Kirk Lindstrom's Investment Letter are again at record all time highs. Subscribe today and get the June 2014 Issue for FREE!

Located between Apple, Google, Facebook and Tesla and just a short drive to Stanford University, Los Altos is central to many of today's growing companies that turned founders and employees into recent millionaires.  With some of the top schools in the country, Los Altos is a prime target for young tech titans looking to diversify their stock holdings and settle down to raise a family or just live in a town with a low crime rate.

The average single-family home price for a home in Los Altos as of May 2014 is $2,541,631


The average price for condos & townhomes in Los Altos as of May 2014 is $1,190,941 


Is this the top of another bubble or have towns with good schools and large lots in the Silicon Valley joined the ranks of world class locations like London, New York, Paris, etc. as places people want to live and those with money will keep the prices going up?

The three portfolios in Kirk Lindstrom's Investment Letter are again at record all time highs.  
Subscribe today and get the June 2014 Issue for FREE!


Wednesday, June 11, 2014

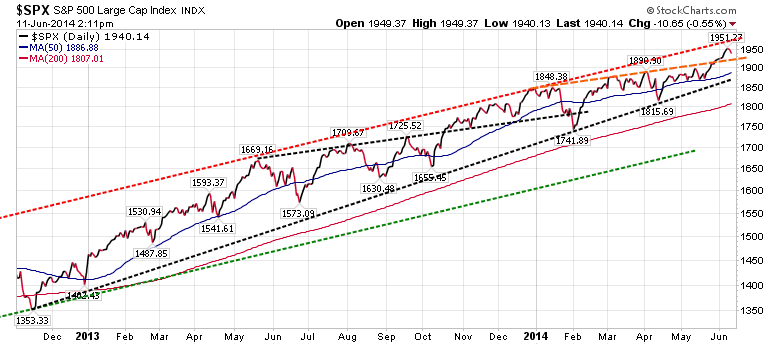
Support & Resistance Levels for the S&P500

It would be really healthy for the market to test the breakout of the dashed orange lines from above.  This would be about 1,930.
Note that this second chart shows  a similar break above a trend line in October 2013 that was tested from above once in November 2013 before the market rallied all the way up to the dashed red resistance line.
Support Levels for S&P500
  1. About 1930
  2. The 50 DMA (day moving average) currently at 1887
  3. The dashed black trend line at about 1825
  4. The 200 DMA currently at 1807
Resistance Levels for S&P500
  1. About 1975
Currently my portfolios are at record all-time highs.  I've taken some profits and have plenty of cash to buy any major declines yet I am "fully invested" to take advantage if (when) the market goes higher.

Learn the "Core and Explore" approach to investing
with "Kirk Lindstrom's Investment Letter"
Subscribe NOW and get the June 2014 Issue for FREE!   
(Your 1 year, 12 issue subscription will start with next month's issue.)
(More Info
Testimonials Portfolio Returns)
See my just published article: 
Note how the DOW remains below its long-term trend lines.

Is it too late to buy stocks? No! It is hard to believe how many individual investors are still under invested in stocks.  Two bear markets that took the S&P500 down over 50% each time between 2000 and 2009 scared many into cash and bonds.  Most are only starting to get back into stocks. The fear may take a generation, or at least 20 years, for investors to return to "proper asset allocations." 

  • You can pay for the newsletter for a year with one successful Explore Portfolio trade and then follow the core portfolios essentially for free.
Note, you can do great just following my core portfolios by reading pages 1 to 12 each month of my newsletter and ignoring the rest that covers individual stocks.  The price is still better than competitive "mutual fund newsletters" that don't have the same long-term, documented (see attachment) performance.  

Friday, June 06, 2014

ECRI's US FIG Indicates Building Inflation Pressure

On Friday June 6, 2014, the Economic Cycle Research Institute (ECRI), a New York-based independent forecasting group, released its latest readings for its proprietary U.S. Future Inflation Gauge (USFIG) for May 2014.  The value of the USFIG lies in its ability to measure underlying inflationary pressures and thereby predict turning points in the U.S. inflation cycle.

In the latest release, for the week ending May 16, 2014, USFIG rose ECRI’s USFIG rose a bit further in May to 105.2 from the March reading of 104.9.


Lakshman Achuthan,ECRI's managing director, said "With the USFIG reaching a 13-month high, underlying inflation pressures have begun to build."

ECRI’s Recommended Books:


Followers - Click "follow" to get an email alert for new articles

Kirk Lindstrom's Investment Letter Performance