Don't Miss Out On Great Gains! - Best Investment Newsletter


Click for FREE sample of Kirk Lindstrom's Investment Letter

Don't miss out! Subscribe Now

google.com, pub-7001134751860982, DIRECT, f08c47fec0942fa0

Search For More

Monday, March 25, 2019

Relationships between Treasury Rates, Yield Curve Inversions, Recessions and the Stock Market

Here are some charts showing clear relationships between US Treasury rates, yield curve Inversions, recessions and the Stock Market.

This is the curve that has so many talking about inversion with the 3-month US treasury paying 0.02% more than the 10-year US Treasury.


Yield Curve 10yr - 3Mo
This is the curve that looks out 30 years compared to 1 year:
Yield Curve 30yr-1yr

Yield Curve:  30yr / 3Mo

Rates 10 & 30 Year USTs


Don't miss out!

And get the March Issue for FREE!

Speaking about yield inversion, Art Cashin, UBS Director of Floor Operations, said on CNBC on 3/25/19:
Every inversion is not followed by a recession but every recession is proceeded by an inversion.  So is it worrisome, Yes?  Is it a guarantee?  No.
S&P 500 Chart:

Wednesday, March 06, 2019

2019 January Treasury Surplus Smaller than January 2018 - Government Shutdown to Blame?

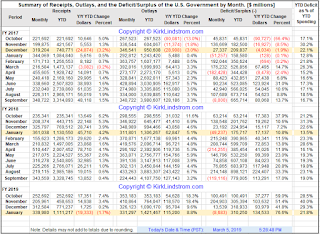
My table below shows a "Summary of Receipts, Outlays, and the Deficit/Surplus of the U.S. Government by Month Through January 2019."

Unfortunately, the "Estimated Tax Payment" for the 2018 tax year that I (and others) sent in January 2019  to the US Treasury was not large enough to cause the surplus to grow compared to January 2018.  Was the government shutdown to blame?

The Monthly Treasury Statement summarizes the financial activities of the federal government and off-budget federal entities and conforms to the Budget of the U.S. Government.

You can never have too much data so I process the latest reports to see tax collections, spending and the official deficit behaves without "noise" from the obviously biased MSM "Main Stream Media."
Table 1
Summary of Receipts, Outlays, and the Deficit/Surplus of the U.S. Government by Month. [$ millions]
From the data in Table 1, you can clearly see:
  • Taxes collected in January 2019 were lower than taxes collected in January 2018 
  • It is possible this decline is due to the government shutdown so we'll have to keep an eye on the data to see if it recovers now that the government is open for business again.

From the data in Table 2, you can clearly see:

  • Tax collections during the first four months of fiscal 2018 grew year over year and month over month over fiscal 2017 but
  • after a good start in October of FY-2019 with monthly tax collection growth of 7.41%, tax collections have fallen on a monthly basis and
  • tax collections on a year over year basis fell by 1.7%, the first decline since March of FY-2017 when they fell by 0.2%.  

The worst news is the deficit continues to grow at an alarming rate.  

The good news is the US Stock Market, so far, doesn't seem to mind as long as interest rates remain relatively low and the Fed remains in a "holding pattern" where it does not raise the Fed Funds rate until we get by this "soft spot" in the US and global economy.


Don't miss out!


NOTE: Due to the lapse in appropriation, the dates for publication of the Monthly Treasury Statement (MTS) for December, January, and February have changed. Here are the revised dates:
  • December MTS – Publish on 2/13
  • January MTS – Publish on 3/5
  • February MTS – Publish on 3/22
  • March MTS – On normal schedule

Saturday, March 02, 2019

Keysight: Semiconductor Arms Dealer or Picks and Shovel Maker, Consider KEYS

Yesterday Barron's ran an article Forget the Cool New Products; Buy the "Arms Dealers" The article recommended several of my favorite semiconductor and semiconductor capital equipment stocks that make possible the semiconductors in these new products but it left off one of my new favorites, Keysight Technologies, KEYS. 

I have made a lot of money with several of these stocks over the past 20 plus years I've covered them in my newsletter as makers of  "picks and shovels."  This is the same idea as "Arms Dealers" but I think better reflects my California roots where gold miners came here in the mid 1800s to make their fortune mining gold.  Very few minors made great fortunes but those selling them "picks and shovels"  and "Levi's Jeans" made money from all miners, not just those who struck gold.
As a shareholder of Agilent (A Chartssince its IPO, I was well aware of the quality of Keysight's products when Agilent spun-off Keysight.  I started accumulating more shares when it fell using profits taken in other stocks. 

It was tough accumulating more Keysight shares after its IPO & spin-off from Agilent due to the falling price and low analyst interest. Analysts did not have an estimate of forward earnings growth estimates until sometime between 2017 or 2018.  Data from my newsletters going back two years:

KEYS 5-yr Growth Estimate as of: 

  • 1/18/17 =  None!
  • 1/18/18 = 8.66%
  • 1/16/19 = 18.35%

Here is an excerpt from my 2017 newsletter to show what I mean

It looked "expensive" based on PE and PEG until recently when, of course, analysts joined me in seeing the potential and gave it a decent growth rate so next year's PEG was 1.05 when I did the February newsletter calculations.

As tough as it was accumulating... I've taken some profits (at $80) and watch it go higher but we did get some shares back late last year for the portfolio at a great price so it made taking profits easier.

The "Explore Portfolio" covered in Kirk Lindstrom's Investment Letter closed Friday at another record high!
 Subscribe NOW
and get the February 2019 Issue for FREE!!!
.

Friday, March 01, 2019

New Record High, Interest Rates & CPC Investor Sentiment Indicator

Weekend Market Update
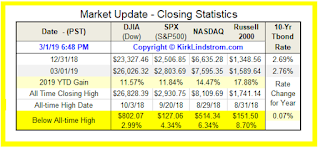
 After making bear market lows, down 20% or more during the Christmas Holiday, the four major US stock market indexes soared such that they are only down between 2.99% and 8.70% from their record highs.

The "Explore Portfolio" covered in Kirk Lindstrom's Investment Letter today closed at another record high!

 Subscribe NOW
and get the February 2019 Issue for FREE!!!
Interest rates are up but still very low on an historical basis.
After doing a lot of buying around the holidays when the markets were near their lows, my CPC Put/Call sentiment indicator is now well into the "take profits" zone.

To understand more about my method, please read these KEY articles:
Discuss this article on my "Investing for the long term" Facebook group. 
.

Followers - Click "follow" to get an email alert for new articles

Kirk Lindstrom's Investment Letter Performance